

Question: (a) Consider the network shown in Fig.Q3(a). a d e Flow 1: a, b, e Flow 2: e, c, a Flow 3: b, e
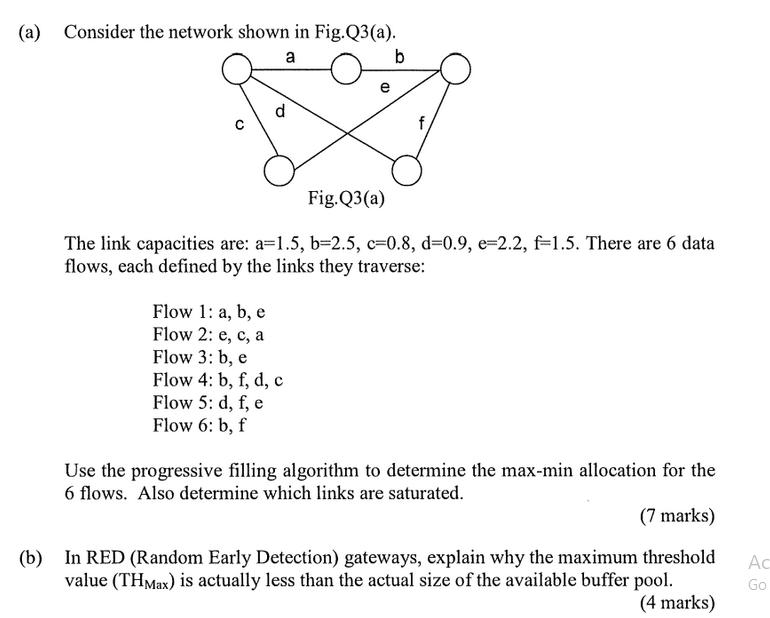
(a) Consider the network shown in Fig.Q3(a). a d e Flow 1: a, b, e Flow 2: e, c, a Flow 3: b, e Flow 4: b, f, d, c Flow 5: d, f, e Flow 6: b, f b Fig.Q3(a) The link capacities are: a-1.5, b=2.5, c-0.8, d=0.9, e-2.2, f-1.5. There are 6 data flows, each defined by the links they traverse: Use the progressive filling algorithm to determine the max-min allocation for the 6 flows. Also determine which links are saturated. (7 marks) (b) In RED (Random Early Detection) gateways, explain why the maximum threshold value (THMax) is actually less than the actual size of the available buffer pool. (4 marks) Ac Go
Step by Step Solution
There are 3 Steps involved in it
The provided image displays a network diagram alongside a text segment referring to a problem given in subsection a asking to use the progressive filling algorithm to find the maxmin allocation for si... View full answer

Get step-by-step solutions from verified subject matter experts