

Question: a) Consider this table that shows the average saving rate (as a percent) for employees that chose to participate in the SMarT plan (see Thaler
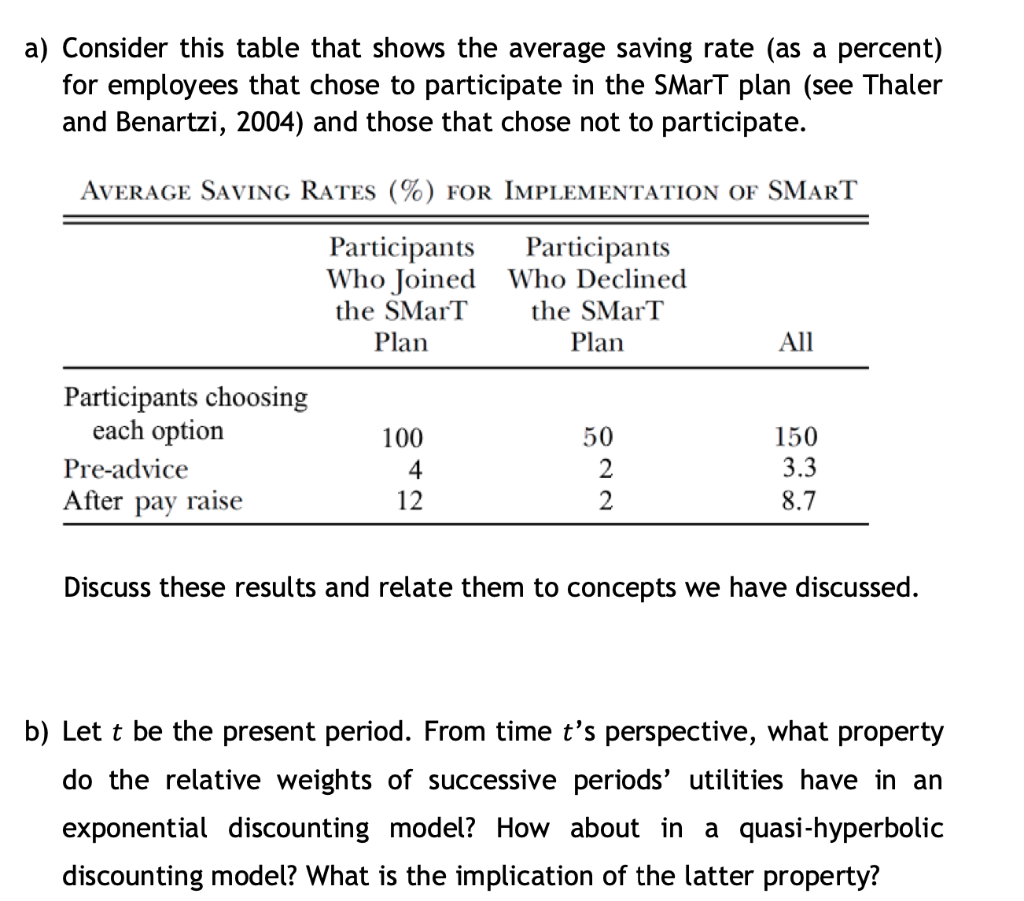
a) Consider this table that shows the average saving rate (as a percent) for employees that chose to participate in the SMarT plan (see Thaler and Benartzi, 2004) and those that chose not to participate. AVERAGE SAVING RATES (%) FOR IMPLEMENTATION OF SMART Participants Participants Who Declined Who Joined the SMarT the SMarT Plan Plan All Participants choosing each option 100 150 Pre-advice 4 3.3 After pay raise 12 2 8.7 Discuss these results and relate them to concepts we have discussed. b) Lett be the present period. From time t's perspective, what property do the relative weights of successive periods' utilities have in an exponential discounting model? How about in a quasi-hyperbolic discounting model? What is the implication of the latter property? ONN 50 2 a) Consider this table that shows the average saving rate (as a percent) for employees that chose to participate in the SMarT plan (see Thaler and Benartzi, 2004) and those that chose not to participate. AVERAGE SAVING RATES (%) FOR IMPLEMENTATION OF SMART Participants Participants Who Declined Who Joined the SMarT the SMarT Plan Plan All Participants choosing each option 100 150 Pre-advice 4 3.3 After pay raise 12 2 8.7 Discuss these results and relate them to concepts we have discussed. b) Lett be the present period. From time t's perspective, what property do the relative weights of successive periods' utilities have in an exponential discounting model? How about in a quasi-hyperbolic discounting model? What is the implication of the latter property? ONN 50 2
Step by Step Solution
There are 3 Steps involved in it

Get step-by-step solutions from verified subject matter experts