

Question: a). Construct a bivariate table containing the appropriatefrequency and percentages for each cell in the table.The independent variable, region, should be in the columns and
a). Construct a bivariate table containing the appropriatefrequency and percentages for each cell in the table.The independent variable, region, should be in the columns and the dependent variable, whether or not a person has health insurance, should be in the rows. Include the row and column total percentages.
b). Once you are done, interprete the relationship between region and access to health insurance depicted in the table, using selected % to document your claims.
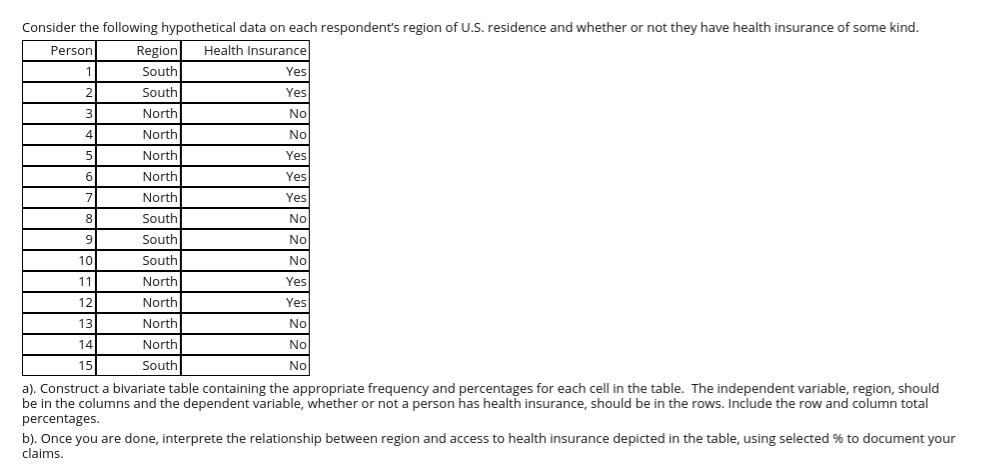
Consider the following hypothetical data on each respondent's region of U.S. residence and whether or not they have health insurance of some kind. Person Region Health Insurance South Yes South Yes North No North No North Yes North Yes North Yes South No South No 10 South No 11 North Yes 12 North Yes 13 North No 14 North No 15 South No a). Construct a bivariate table containing the appropriate frequency and percentages for each cell in the table. The independent variable, region, should be in the columns and the dependent variable, whether or not a person has health insurance, should be in the rows. Include the row and column total percentages. b). Once you are done, interprete the relationship between region and access to health insurance depicted in the table, using selected % to document your claims
Step by Step Solution
There are 3 Steps involved in it

Get step-by-step solutions from verified subject matter experts