

Question: a. Construct a scatter diagram graph that shows Batas and Renatas returns on the vertical axis and the market indexs returns on the horizontal axis.
a. Construct a scatter diagram graph that shows Batas and Renatas returns on the vertical axis and the market indexs returns on the horizontal axis.
b. Estimate Batas and Renatas betas by running regressions of their returns against the Market Indexs returns. Are these betas consistent with your graph?
c. The risk-free rate on long-term Treasury bonds is 6.04%. Assume that the market risk premium is 7%. What is the expected return on the market? Now use the SML equation to calculate the two companies required returns.
D. If you formed a portfolio that consisted of 58% Bata and 42% Renata, what would be its beta and its required return?
E. Suppose an investor wants to include Bata Shoes stock in his or her portfolio. Stocks A, B, and C are currently in the portfolio, and their betas are 0.769, 0.985, and 1.423, respectively. Calculate the new portfolios required return if it consists of 25 percent of Bata, 15 percent of Stock A, 40 percent of Stock B, and 20 percent of Stock C.
Please answer your working in Excel
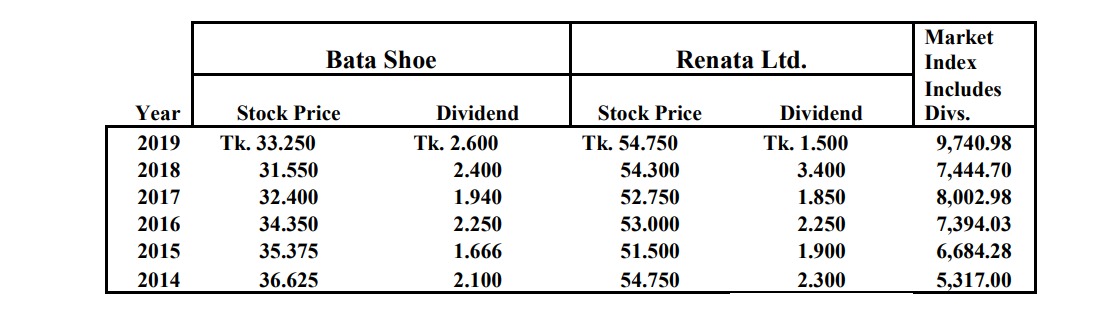
Bata Shoe Renata Ltd. Year 2019 2018 2017 2016 2015 2014 Stock Price Tk. 33.250 31.550 32.400 34.350 35.375 36.625 Dividend Tk. 2.600 2.400 1.940 2.250 1.666 2.100 Stock Price Tk. 54.750 54.300 52.750 53.000 51.500 54.750 Dividend Tk. 1.500 3.400 1.850 2.250 1.900 2.300 Market Index Includes Divs. 9,740.98 7,444.70 8,002.98 7,394.03 6,684.28 5,317.00 Bata Shoe Renata Ltd. Year 2019 2018 2017 2016 2015 2014 Stock Price Tk. 33.250 31.550 32.400 34.350 35.375 36.625 Dividend Tk. 2.600 2.400 1.940 2.250 1.666 2.100 Stock Price Tk. 54.750 54.300 52.750 53.000 51.500 54.750 Dividend Tk. 1.500 3.400 1.850 2.250 1.900 2.300 Market Index Includes Divs. 9,740.98 7,444.70 8,002.98 7,394.03 6,684.28 5,317.00
Step by Step Solution
There are 3 Steps involved in it

Get step-by-step solutions from verified subject matter experts