

Question: A. construct a scatterplot. choose the correct graph. b. assuming a linear relationship use the least squares method to compute the regression coefficient b0 and
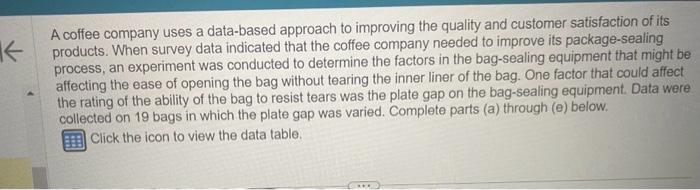
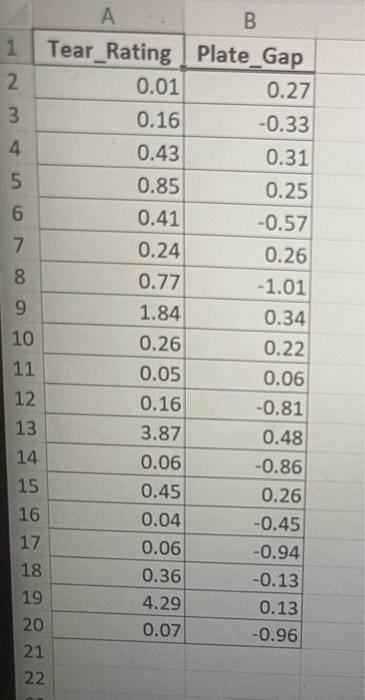
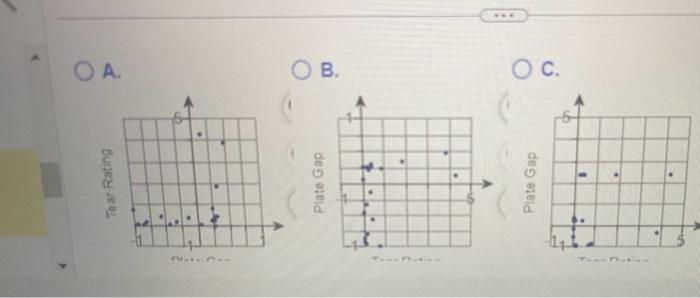
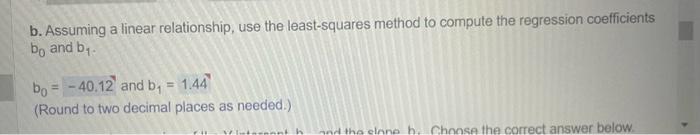
A coffee company uses a data-based approach to improving the quality and customer satisfaction of its products. When survey data indicated that the coffee company needed to improve its package-sealing process, an experiment was conducted to determine the factors in the bag-sealing equipment that might be affecting the ease of opening the bag without tearing the inner liner of the bag. One factor that could affect the rating of the ability of the bag to resist tears was the plate gap on the bag-sealing equipment. Data were collected on 19 bags in which the plate gap was varied. Complete parts (a) through (e) below. Click the icon to view the data table. \begin{tabular}{|c|r|r|} \hline & \multicolumn{1}{|c|}{ A } \\ \hline & Tear_Rating & Plate_Gap \\ \hline 2 & 0.01 & 0.27 \\ \hline 3 & 0.16 & -0.33 \\ \hline 4 & 0.43 & 0.31 \\ \hline 5 & 0.85 & 0.25 \\ \hline 6 & 0.41 & -0.57 \\ \hline 7 & 0.24 & 0.26 \\ \hline 8 & 0.77 & -1.01 \\ \hline 9 & 1.84 & 0.34 \\ \hline 10 & 0.26 & 0.22 \\ \hline 11 & 0.05 & 0.06 \\ \hline 12 & 0.16 & -0.81 \\ \hline 13 & 3.87 & 0.48 \\ \hline 14 & 0.06 & -0.86 \\ \hline 15 & 0.45 & 0.26 \\ \hline 16 & 0.04 & -0.45 \\ \hline 17 & 0.06 & -0.94 \\ \hline 18 & 0.36 & -0.13 \\ \hline 19 & 4.29 & 0.13 \\ \hline 20 & 0.07 & -0.96 \\ \hline \end{tabular} A. B. C. b. Assuming a linear relationship, use the least-squares method to compute the regression coefficients b0 and b1. b0=andb1=1.44 (Round to two decimal places as needed.) A coffee company uses a data-based approach to improving the quality and customer satisfaction of its products. When survey data indicated that the coffee company needed to improve its package-sealing process, an experiment was conducted to determine the factors in the bag-sealing equipment that might be affecting the ease of opening the bag without tearing the inner liner of the bag. One factor that could affect the rating of the ability of the bag to resist tears was the plate gap on the bag-sealing equipment. Data were collected on 19 bags in which the plate gap was varied. Complete parts (a) through (e) below. Click the icon to view the data table. \begin{tabular}{|c|r|r|} \hline & \multicolumn{1}{|c|}{ A } \\ \hline & Tear_Rating & Plate_Gap \\ \hline 2 & 0.01 & 0.27 \\ \hline 3 & 0.16 & -0.33 \\ \hline 4 & 0.43 & 0.31 \\ \hline 5 & 0.85 & 0.25 \\ \hline 6 & 0.41 & -0.57 \\ \hline 7 & 0.24 & 0.26 \\ \hline 8 & 0.77 & -1.01 \\ \hline 9 & 1.84 & 0.34 \\ \hline 10 & 0.26 & 0.22 \\ \hline 11 & 0.05 & 0.06 \\ \hline 12 & 0.16 & -0.81 \\ \hline 13 & 3.87 & 0.48 \\ \hline 14 & 0.06 & -0.86 \\ \hline 15 & 0.45 & 0.26 \\ \hline 16 & 0.04 & -0.45 \\ \hline 17 & 0.06 & -0.94 \\ \hline 18 & 0.36 & -0.13 \\ \hline 19 & 4.29 & 0.13 \\ \hline 20 & 0.07 & -0.96 \\ \hline \end{tabular} A. B. C. b. Assuming a linear relationship, use the least-squares method to compute the regression coefficients b0 and b1. b0=andb1=1.44 (Round to two decimal places as needed.)
Step by Step Solution
There are 3 Steps involved in it

Get step-by-step solutions from verified subject matter experts