

Question: a. Construct a time-series graph of the sales data for HeathCo's line of skiwear (see data in c5p11 ). Does there appear to be a
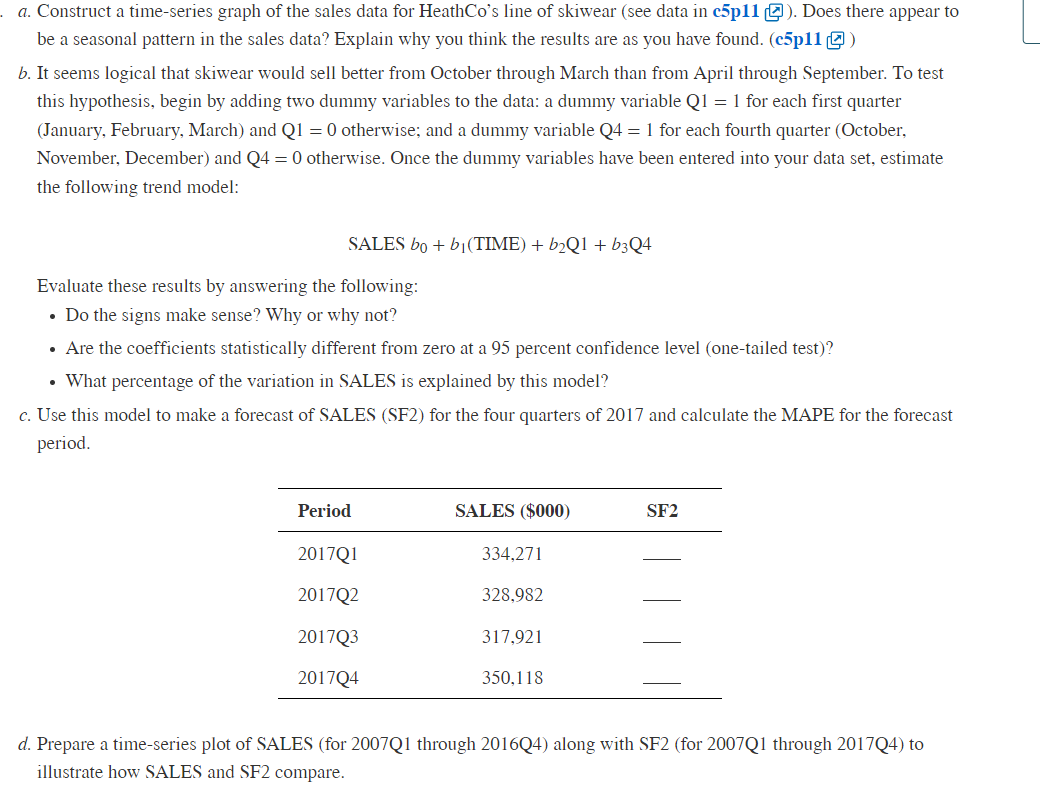
a. Construct a time-series graph of the sales data for HeathCo's line of skiwear (see data in c5p11 ). Does there appear to be a seasonal pattern in the sales data? Explain why you think the results are as you have found. (c5p11 ) b. It seems logical that skiwear would sell better from October through March than from April through September. To test this hypothesis, begin by adding two dummy variables to the data: a dummy variable Q1 = 1 for each first quarter (January, February, March) and Q1 = 0 otherwise; and a dummy variable Q4 =1 for each fourth quarter (October, November, December) and Q4 =0 otherwise. Once the dummy variables have been entered into your data set, estimate the following trend model: SALES b0+b1(TIME)+b2Q1+b3Q4 Evaluate these results by answering the following: - Do the signs make sense? Why or why not? - Are the coefficients statistically different from zero at a 95 percent confidence level (one-tailed test)? - What percentage of the variation in SALES is explained by this model? c. Use this model to make a forecast of SALES (SF2) for the four quarters of 2017 and calculate the MAPE for the forecast period. d. Prepare a time-series plot of SALES (for 2007Q1 through 2016Q4) along with SF2 (for 2007Q1 through 2017Q4) to illustrate how SALES and SF2 compare
Step by Step Solution
There are 3 Steps involved in it
a TimeSeries Graph and Seasonality Interpretation Observations from the Graph ... View full answer

Get step-by-step solutions from verified subject matter experts