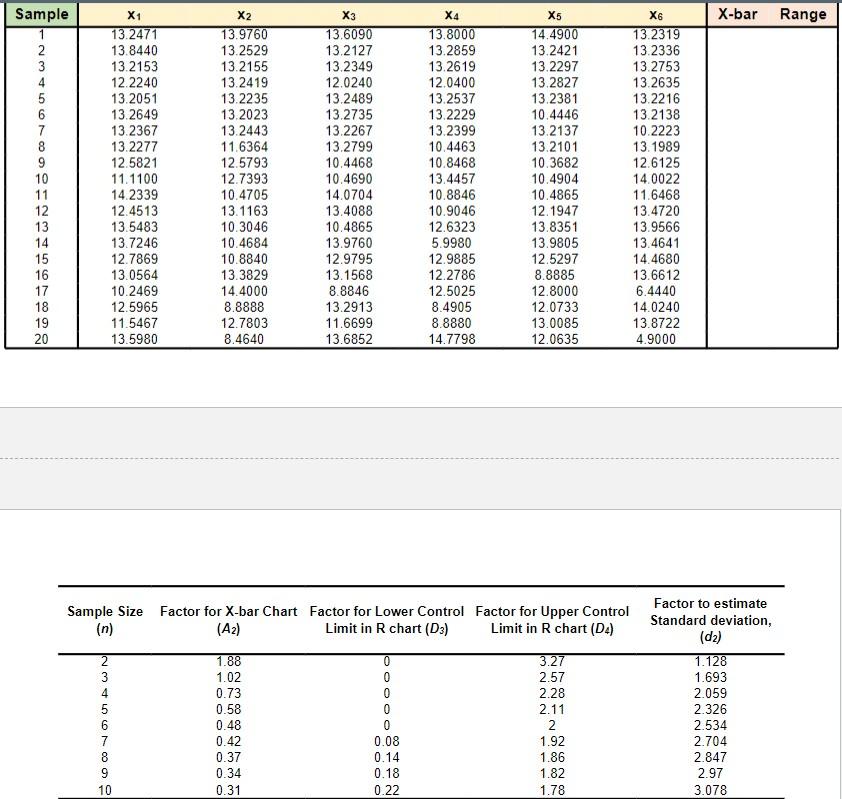
Question: (a) Construct an X-bar chart for this manufacturing line: i. Is this process in control? ii. Do you notice any problems despite your answer to

(a) Construct an X-bar chart for this

(a) Construct an X-bar chart for this

(a) Construct an X-bar chart for this manufacturing line: i. Is this process "in control"? ii. Do you notice any problems despite your answer to Part i? (b) Construct an R-Chart for this manufacturing line: \begin{tabular}{cccccc} \hline Sample Size (n) & Factor for X-bar Chart (A2) & Factor for Lower Control Limit in R chart (D3) & Factor for Upper Control Limit in R chart (D4) & Factor to estimate Standard deviation, (d2) \\ \hline 2 & 1.88 & 0 & 3.27 & 1.128 \\ 3 & 1.02 & 0 & 2.57 & 1.693 \\ 4 & 0.73 & 0 & 2.28 & 2.059 \\ 5 & 0.58 & 0 & 2 & 2.326 \\ 6 & 0.48 & 0 & 1.92 & 2.534 \\ 7 & 0.42 & 0.08 & 1.86 & 2.704 \\ 9 & 0.37 & 0.14 & 1.82 & 2.847 \\ 9 & 0.34 & 0.18 & 1.78 & 2.97 \\ \hline 10 & 0.31 & 0.22 & & 3.078 \\ \hline \end{tabular}

Step by Step Solution

There are 3 Steps involved in it

1 Expert Approved Answer
Step: 1 Unlock blur-text-image
Question Has Been Solved by an Expert!

Get step-by-step solutions from verified subject matter experts

Step: 2 Unlock
Step: 3 Unlock

Students Have Also Explored These Related General Management Questions!