

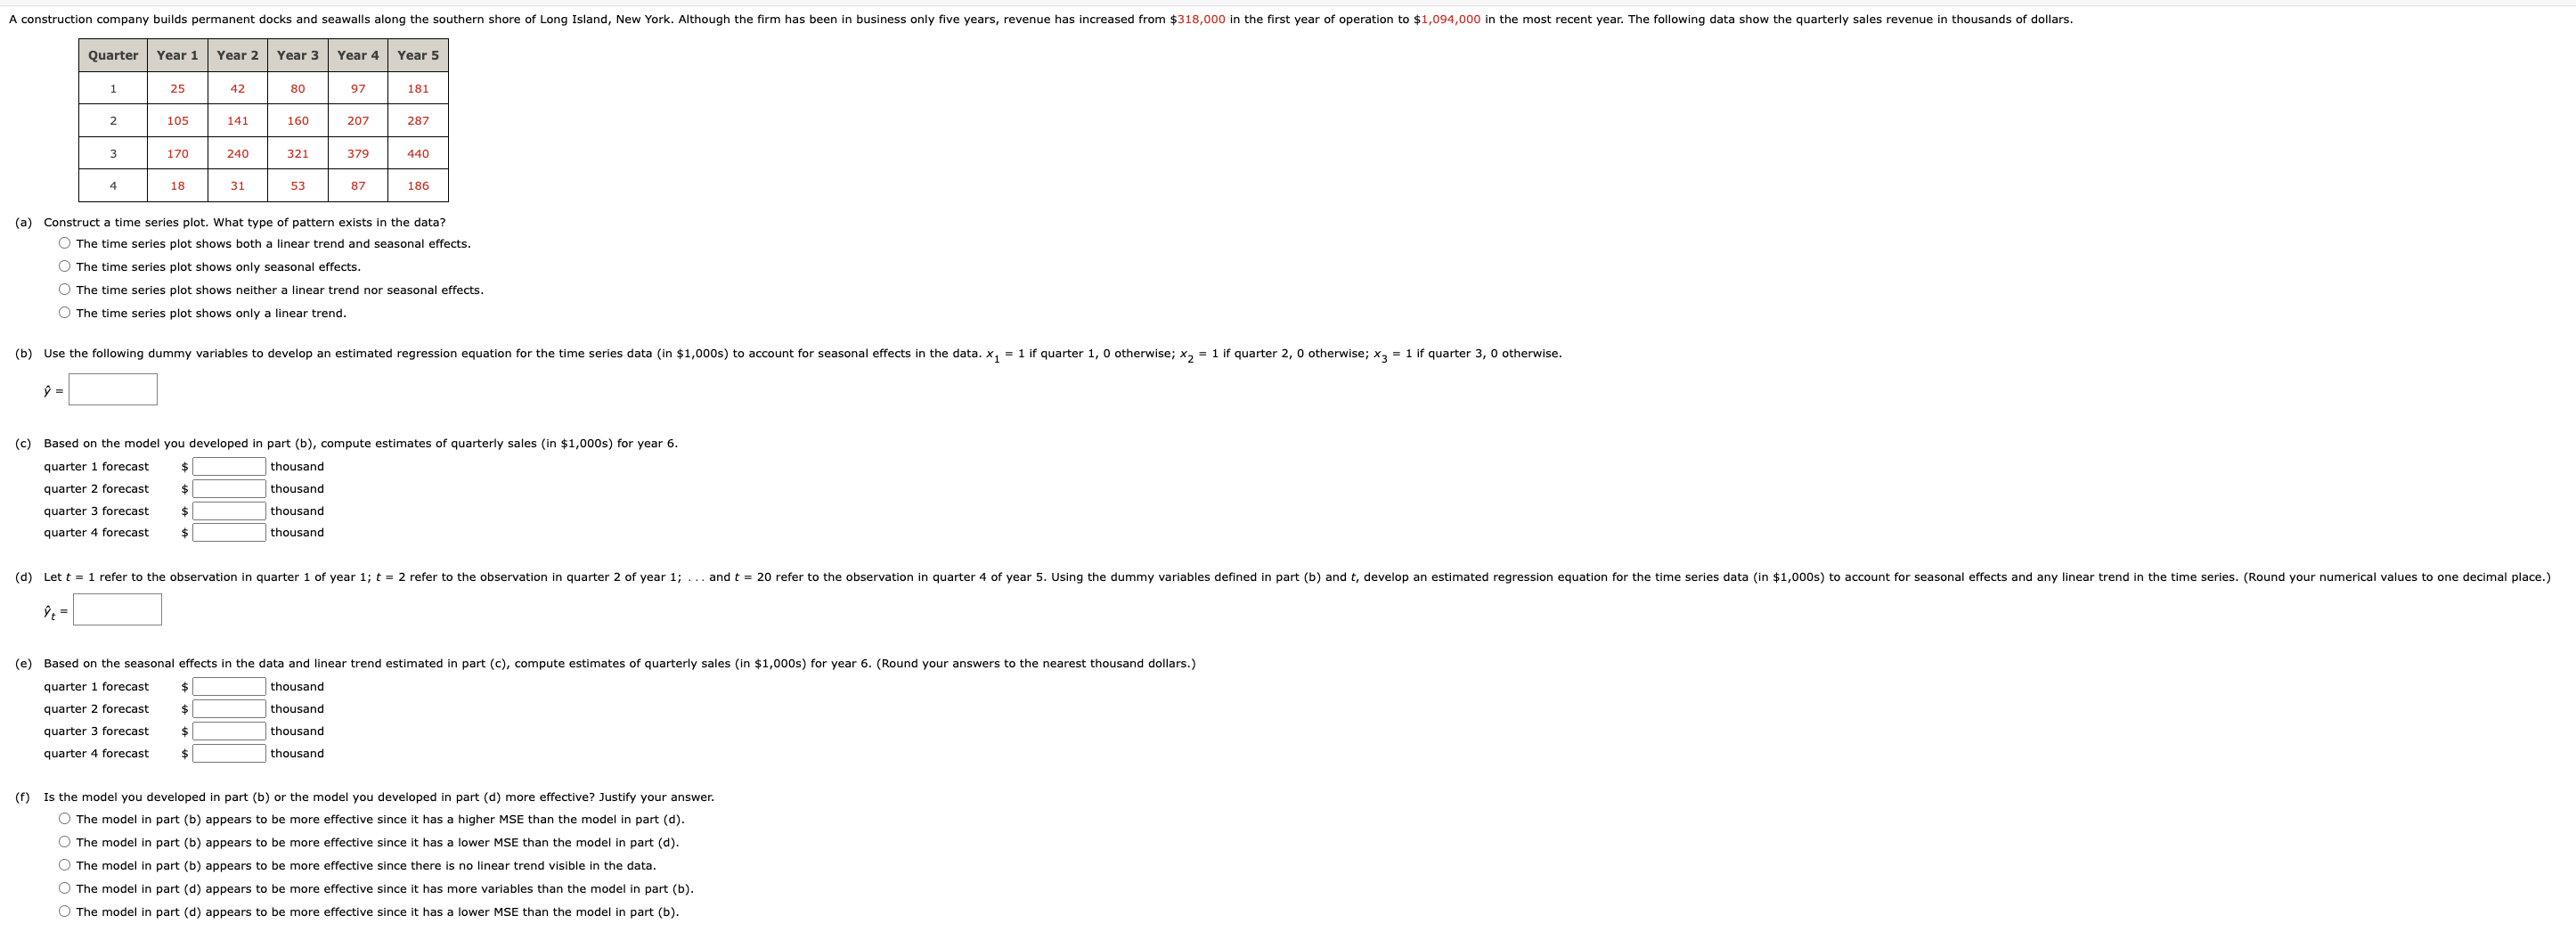
A construction company builds permanent docks and seawalls along the southern shore of Long Island, New...
Fantastic news! We've Found the answer you've been seeking!
Question:
Transcribed Image Text:
A construction company builds permanent docks and seawalls along the southern shore of Long Island, New York. Although the firm has been in business only five years, revenue has increased from $318,000 in the first year of operation to $1,094,000 in the most recent year. The following data show the quarterly sales revenue in thousands of dollars. Quarter Year 1 Year 2 Year 3 Year 4 Year 5 1 25 42 80 80 97 181 2 105 141 160 207 287 3 170 240 321 379 440 4 18 31 53 87 186 (a) Construct a time series plot. What type of pattern exists in the data? The time series plot shows both a linear trend and seasonal effects. The time series plot shows only seasonal effects. The time series plot shows neither a linear trend nor seasonal effects. The time series plot shows only a linear trend. (b) Use the following dummy variables to develop an estimated regression equation for the time series data (in $1,000s) to account for seasonal effects in the data. x = 1 if quarter 1, 0 otherwise; x2 = 1 if quarter 2, 0 otherwise; x3 = 1 if quarter 3, 0 otherwise. = (c) Based on the model you developed in part (b), compute estimates of quarterly sales (in $1,000s) for year 6. quarter 1 forecast $ thousand quarter 2 forecast quarter 3 forecast $ thousand quarter 4 forecast $ $ thousand thousand (d) Lett 1 refer to the observation in quarter 1 of year 1; t = 2 refer to the observation in quarter 2 of year 1; ... and t = 20 refer to the observation in quarter 4 of year 5. Using the dummy variables defined in part (b) and t, develop an estimated regression equation for the time series data (in $1,000s) to account for seasonal effects and any linear trend in the time series. (Round your numerical values to one decimal place.) (e) Based on the seasonal effects in the data and linear trend estimated in part (c), compute estimates of quarterly sales (in $1,000s) for year 6. (Round your answers to the nearest thousand dollars.) quarter 1 forecast $ thousand quarter 2 forecast $ thousand quarter 3 forecast quarter 4 forecast $ $ thousand thousand (f) Is the model you developed in part (b) or the model you developed in part (d) more effective? Justify your answer. The model in part (b) appears to be more effective since it has a higher MSE than the model in part (d). The model in part (b) appears to be more effective since it has a lower MSE than the model in part (d). The model in part (b) appears to be more effective since there is no linear trend visible in the data. The model in part (d) appears to be more effective since it has more variables than the model in part (b). The model in part (d) appears to be more effective since it has a lower MSE than the model in part (b). A construction company builds permanent docks and seawalls along the southern shore of Long Island, New York. Although the firm has been in business only five years, revenue has increased from $318,000 in the first year of operation to $1,094,000 in the most recent year. The following data show the quarterly sales revenue in thousands of dollars. Quarter Year 1 Year 2 Year 3 Year 4 Year 5 1 25 42 80 80 97 181 2 105 141 160 207 287 3 170 240 321 379 440 4 18 31 53 87 186 (a) Construct a time series plot. What type of pattern exists in the data? The time series plot shows both a linear trend and seasonal effects. The time series plot shows only seasonal effects. The time series plot shows neither a linear trend nor seasonal effects. The time series plot shows only a linear trend. (b) Use the following dummy variables to develop an estimated regression equation for the time series data (in $1,000s) to account for seasonal effects in the data. x = 1 if quarter 1, 0 otherwise; x2 = 1 if quarter 2, 0 otherwise; x3 = 1 if quarter 3, 0 otherwise. = (c) Based on the model you developed in part (b), compute estimates of quarterly sales (in $1,000s) for year 6. quarter 1 forecast $ thousand quarter 2 forecast quarter 3 forecast $ thousand quarter 4 forecast $ $ thousand thousand (d) Lett 1 refer to the observation in quarter 1 of year 1; t = 2 refer to the observation in quarter 2 of year 1; ... and t = 20 refer to the observation in quarter 4 of year 5. Using the dummy variables defined in part (b) and t, develop an estimated regression equation for the time series data (in $1,000s) to account for seasonal effects and any linear trend in the time series. (Round your numerical values to one decimal place.) (e) Based on the seasonal effects in the data and linear trend estimated in part (c), compute estimates of quarterly sales (in $1,000s) for year 6. (Round your answers to the nearest thousand dollars.) quarter 1 forecast $ thousand quarter 2 forecast $ thousand quarter 3 forecast quarter 4 forecast $ $ thousand thousand (f) Is the model you developed in part (b) or the model you developed in part (d) more effective? Justify your answer. The model in part (b) appears to be more effective since it has a higher MSE than the model in part (d). The model in part (b) appears to be more effective since it has a lower MSE than the model in part (d). The model in part (b) appears to be more effective since there is no linear trend visible in the data. The model in part (d) appears to be more effective since it has more variables than the model in part (b). The model in part (d) appears to be more effective since it has a lower MSE than the model in part (b).
Expert Answer:

Posted Date:
Students also viewed these mathematics questions
-
For the manipulator shown, find the twist coordinates f; at zero con- figuration and 9st (0) using the product of exponentials approach. Use the base and tool frames shown. (b) (10 points) Find efi0i...
-
Use the RIA Checkpoint database to answer the following questions. Cut and paste the relevant Internal Revenue Code and Regulation section(s) into your solution and explain how the authority answers...
-
Anthony Liu, CPA, prepared the flowchart on the next page that portrays the raw materials purchasing function of one of Anthonys clients, Medium-Sized Manufacturing Company, from the preparation of...
-
Mercer Inc. is preparing its annual budgets for the year ending December 31, 2010. Accounting assistants furnish the following data. An accounting assistant has prepared the detailed manufacturing...
-
For each of the summarized transactions for the Village of Sycamore General Fund, prepare the general ledger journal entries. The year is January 1December 31, 2012. a. The budget was formally...
-
Use this information for the four questions that follow. A production system requires four machines with the following productivity and layout: ABCD 20 units/hr 18 units/hr 15 units/hr 25 units/hr A...
-
Consider the following fragment of the Mondial Relational Database Schema (RDBMS) and data. Note that a question mark after a column name indicates that the column is nullable, and any primary key...
-
XYZ Company produces and sells AAA batteries. The company faces financial difficulties and must decide to shut down one of its branches. data for the branch follows: Branch A Sales Volume 10,000...
-
You are a Human Resource Manager, and your company is expanding globally to Japan from the US. You have been tasked to create a presentation to present to the Executive Leadership Team that reviews...
-
Do you believe that white collar crime is generally perceived as less egregious than other crimes? Is any level of deception ever ok in the pursuit of profit? Do white collar criminals deserve to be...
-
How can leaders foster a culture of accountability and transparency to enhance collective decision-making within their teams ? Explain
-
What potential products, communication and/or activation ideas can be developed to become a premium face care brand? It should be a detailed answer.
-
Waller, Inc., a glassware manufacturer, provided the following traditional format income statement for the most recent month: Sales $ 275,000 Cost of goods sold 151,250 Gross profit $ 123,750...
-
Difference between truncate & delete

Study smarter with the SolutionInn App