

Question: A construction contractor wants to develop a predictive model for the number of hours to install a boiler drum. The contractor takes data for 36
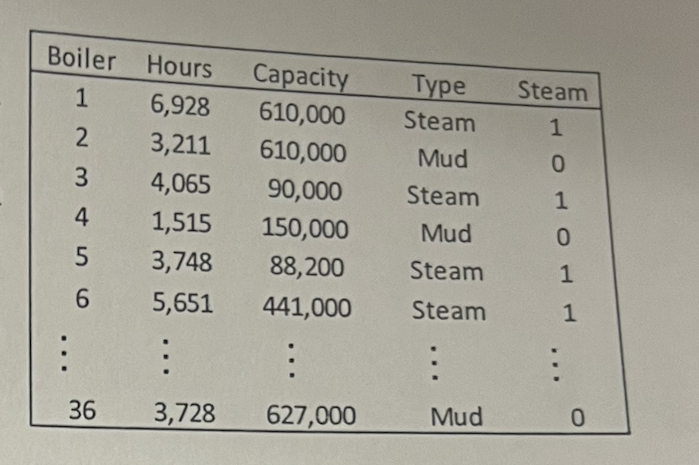
A construction contractor wants to develop a predictive model for the number of hours to install a boiler drum. The contractor takes data for 36 randomly selected installation projects and records the number of hours to install the boiler drum (Hours), the boiler capacity (Capacity) and the boiler type (Steam or Mud). To allow including boiler type in regression models the contractor creates the Steam indictor variable that has the value 1 for a Steam boiler and the value O for a Mud boiler. A portion of the data appears in the table to the right.
a. Sketch the above regression model in the Hours (Y) - Capacity (X) plane. Your sketch should clearly indicate the number of lines in the Hours (Y) - Capacity (X) plane. For each line you should clearly indicate which category of the Type variable the line represents and include values for the slope and intercept.
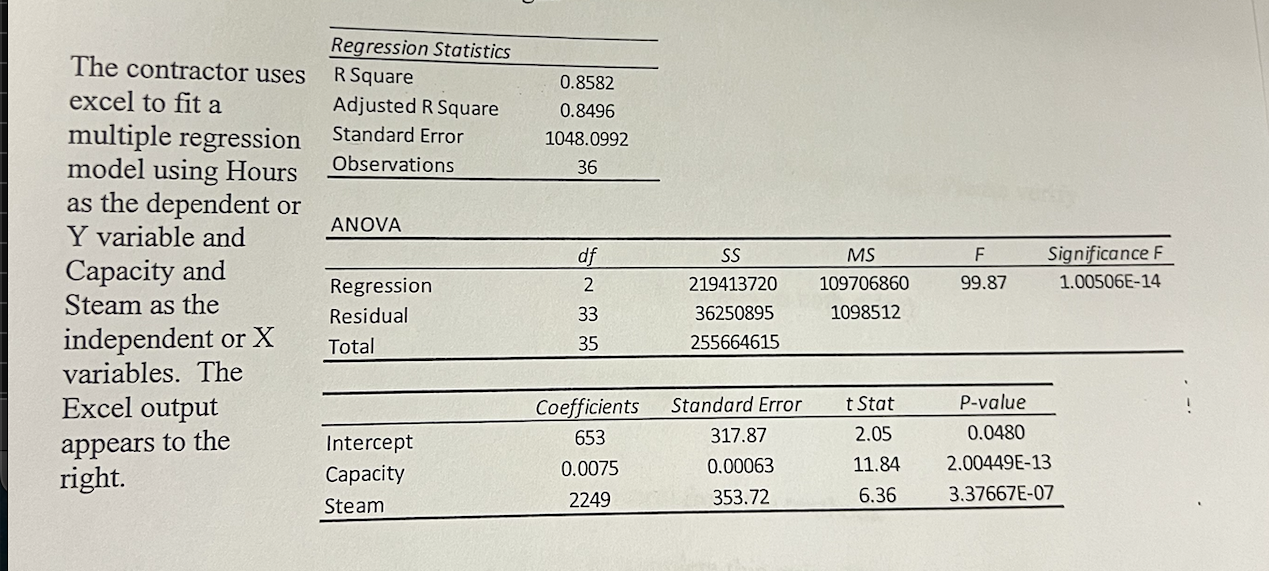
Regression Statistics The contractor uses R Square 0.8582 excel to fit a Adjusted R Square 0.8496 1048.0992 Observations 36 multiple regression Standard Error model using Hours as the dependent or Y variable and Capacity and Steam as the independent or X ANOVA df SS Regression 2 219413720 Residual 33 Total 35 36250895 255664615 MS 109706860 1098512 F Significance F 99.87 1.00506E-14 variables. The Excel output Coefficients Standard Error t Stat P-value appears to the Intercept 653 317.87 2.05 0.0480 right. Capacity 0.0075 0.00063 11.84 2.00449E-13 Steam 2249 353.72 6.36 3.37667E-07
Step by Step Solution
There are 3 Steps involved in it

Get step-by-step solutions from verified subject matter experts