

Question: A consumer preference study compares the effects of three different bottle designs ( A , B , and C ) on sales of a popular
A consumer preference study compares the effects of three different bottle designs (A, B, and C) on sales of a popular fabric softener. A completely randomized design is employed. Specifically, 15 supermarkets of equal sales potential are selected, and 5 of these supermarkets are randomly assigned to each bottle design. The number of bottles sold in 24 hours at each supermarket is recorded. The data obtained are displayed in the following table.
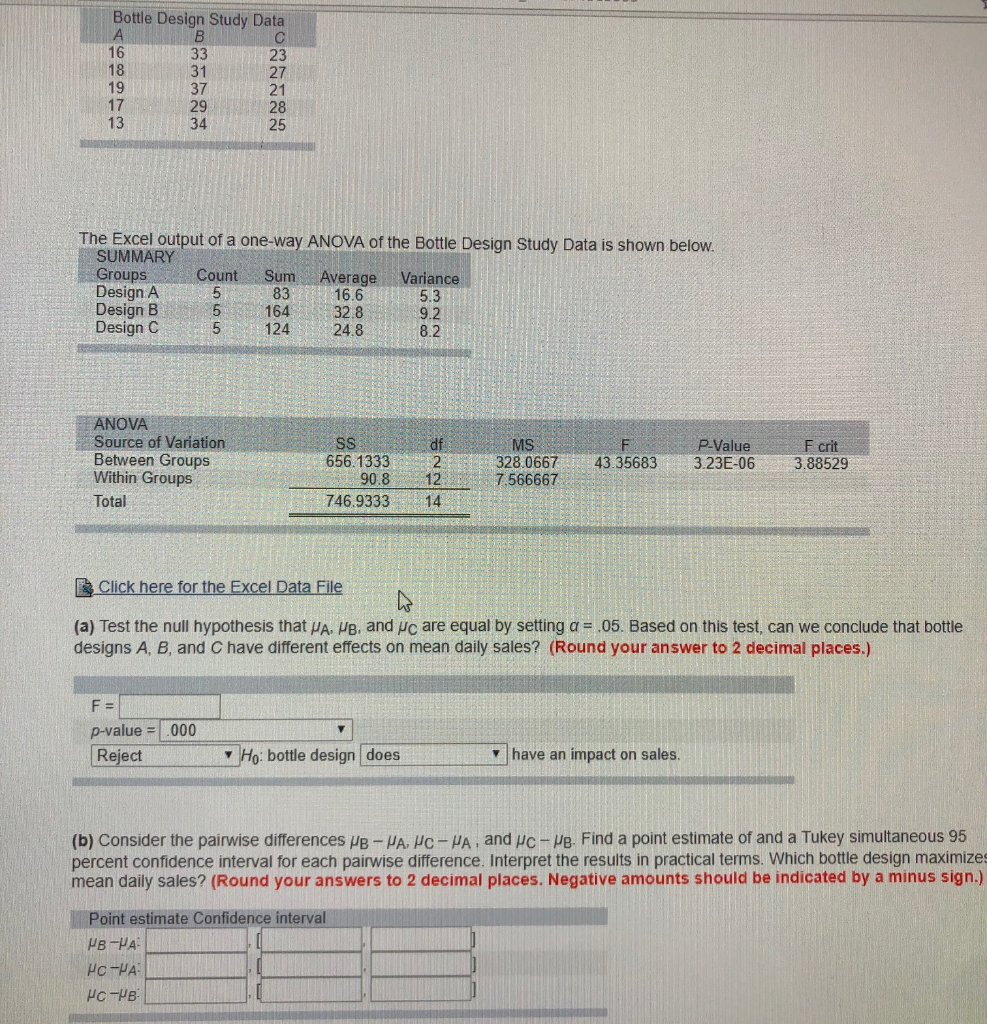
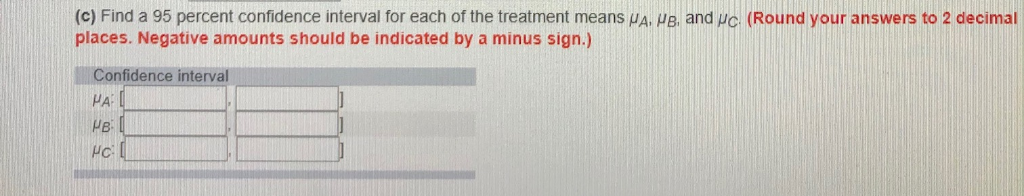
Bottle Design Study Data 16 18 19 17 13 31 37 29 34 23 27 21 28 25 The Excel output of a one-way ANOVA of the Bottle Design Study Data is shown below SUMMARY Groups Design A Design B Design C Count Sum Average Variance 83 16.6 5 164 328 5 124 24.8 5.3 9.2 8.2 ANOVA Source of Variation Between Groups Within Groups Total MS 328.066743.35683 3.23E-06 3.88529 P-Value F crit 656.13332 12 7.566667 746.9333 14 Click here for the Excel Data File (a) Test the null hypothesis that , , and /C are equal by setting .05. Based on this test, can we conclude that bottle designs A, B, and C have different effects on mean daily sales? (Round your answer to 2 decimal places.) p-value 000 RejectHo: bottle design [does have an impact on sales. (b) Consider the pairwise differences 8-. - , and c-re Find a point estimate of and a Tukey simultaneous 95 percent confidence interval for each pairwise difference. Interpret the results in practical terms. Which bottle design maximizes mean daily sales? (Round your answers to 2 decimal places. Negative amounts should be indicated by a minus sign.) Point estimate Confidence interval c) Find a 95 percent confidence interval for each of the treatment means A places. Negative amounts should be indicated by a minus sign.) and (Round your answers to 2 decimal Confidence interval Bottle Design Study Data 16 18 19 17 13 31 37 29 34 23 27 21 28 25 The Excel output of a one-way ANOVA of the Bottle Design Study Data is shown below SUMMARY Groups Design A Design B Design C Count Sum Average Variance 83 16.6 5 164 328 5 124 24.8 5.3 9.2 8.2 ANOVA Source of Variation Between Groups Within Groups Total MS 328.066743.35683 3.23E-06 3.88529 P-Value F crit 656.13332 12 7.566667 746.9333 14 Click here for the Excel Data File (a) Test the null hypothesis that , , and /C are equal by setting .05. Based on this test, can we conclude that bottle designs A, B, and C have different effects on mean daily sales? (Round your answer to 2 decimal places.) p-value 000 RejectHo: bottle design [does have an impact on sales. (b) Consider the pairwise differences 8-. - , and c-re Find a point estimate of and a Tukey simultaneous 95 percent confidence interval for each pairwise difference. Interpret the results in practical terms. Which bottle design maximizes mean daily sales? (Round your answers to 2 decimal places. Negative amounts should be indicated by a minus sign.) Point estimate Confidence interval c) Find a 95 percent confidence interval for each of the treatment means A places. Negative amounts should be indicated by a minus sign.) and (Round your answers to 2 decimal Confidence interval
Step by Step Solution
There are 3 Steps involved in it

Get step-by-step solutions from verified subject matter experts