

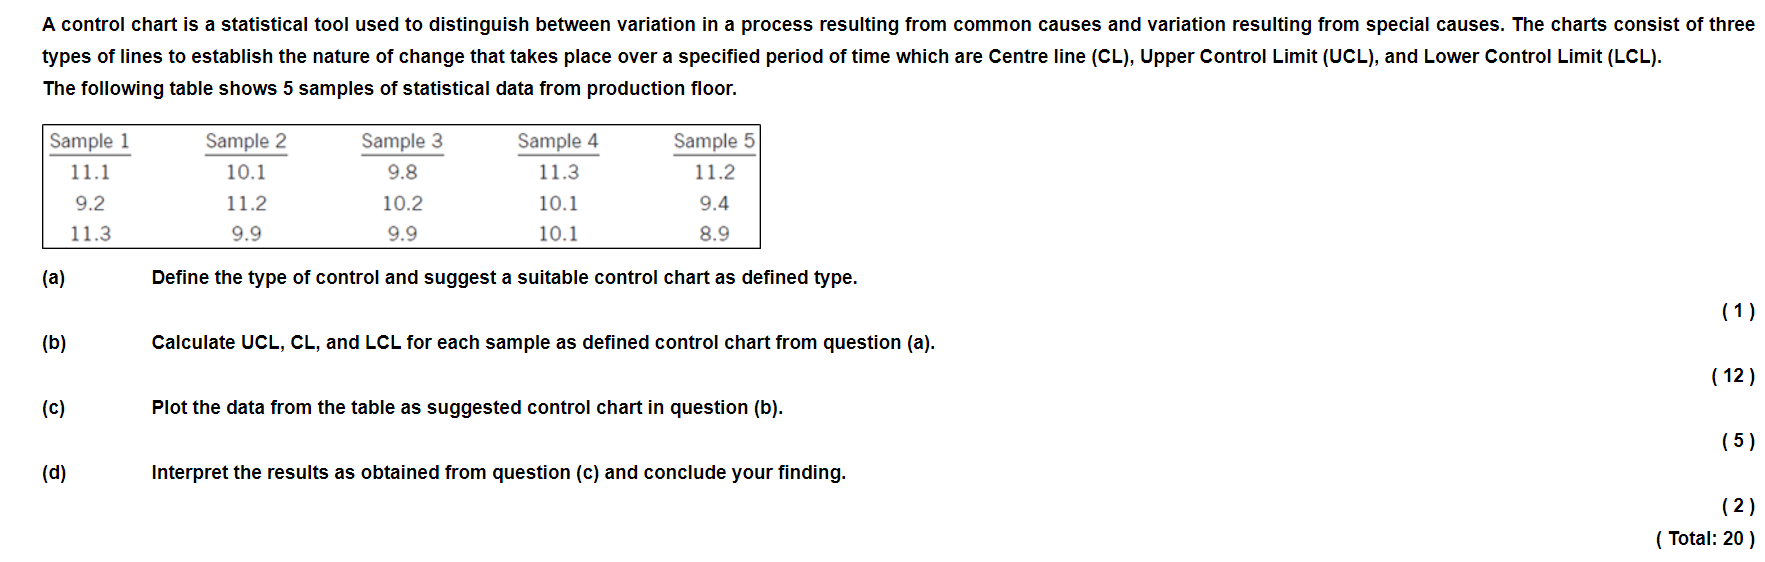
Question: A control chart is a statistical tool used to distinguish between variation in a process resulting from common causes and variation resulting from special causes.
Step by Step Solution
There are 3 Steps involved in it
1 Expert Approved Answer
Step: 1 Unlock

Question Has Been Solved by an Expert!
Get step-by-step solutions from verified subject matter experts
Step: 2 Unlock
Step: 3 Unlock