

Question: A conventional feedback control system depicted in Fig. 1 is considered. The curves (A, B, C) shown in Fig. 2a illustrate the closed-loop responses of
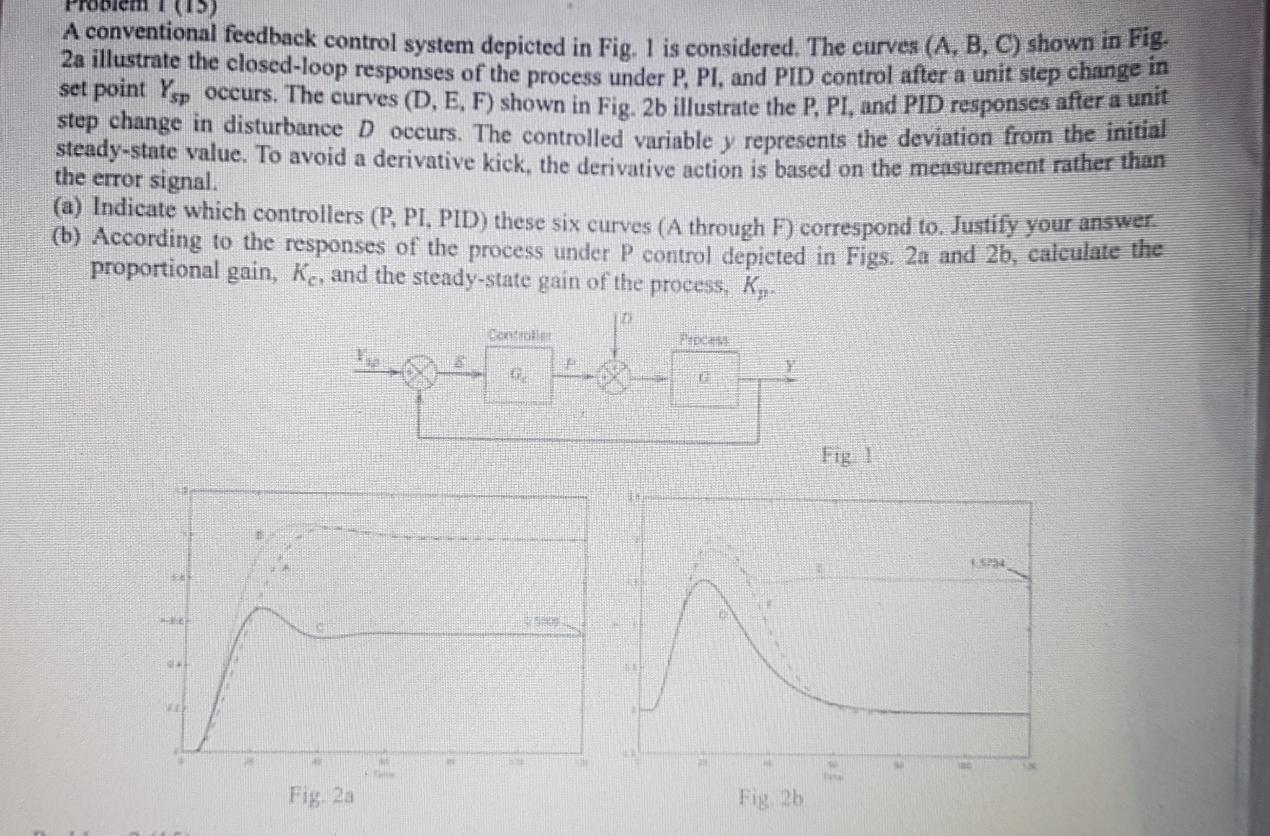
A conventional feedback control system depicted in Fig. 1 is considered. The curves (A, B, C) shown in Fig. 2a illustrate the closed-loop responses of the process under P, PI, and PID control after a unit step change in set point Ysp occurs. The curves (D, E, F) shown in Fig. 2b illustrate the P, PI, and PID responses after a unit step change in disturbance Doccurs. The controlled variable y represents the deviation from the initial steady-state value. To avoid a derivative kick, the derivative action is based on the measurement rather than the error signal. (a) Indicate which controllers (P, PI, PID) these six curves (A through F) correspond to. Justify your answer. (b) According to the responses of the process under P control depicted in Figs. 2a and 26, calculate the proportional gain, K., and the steady-state gain of the process, K. Contio 1234 EE Fig. 2a Fig 26
Step by Step Solution
There are 3 Steps involved in it

Get step-by-step solutions from verified subject matter experts