

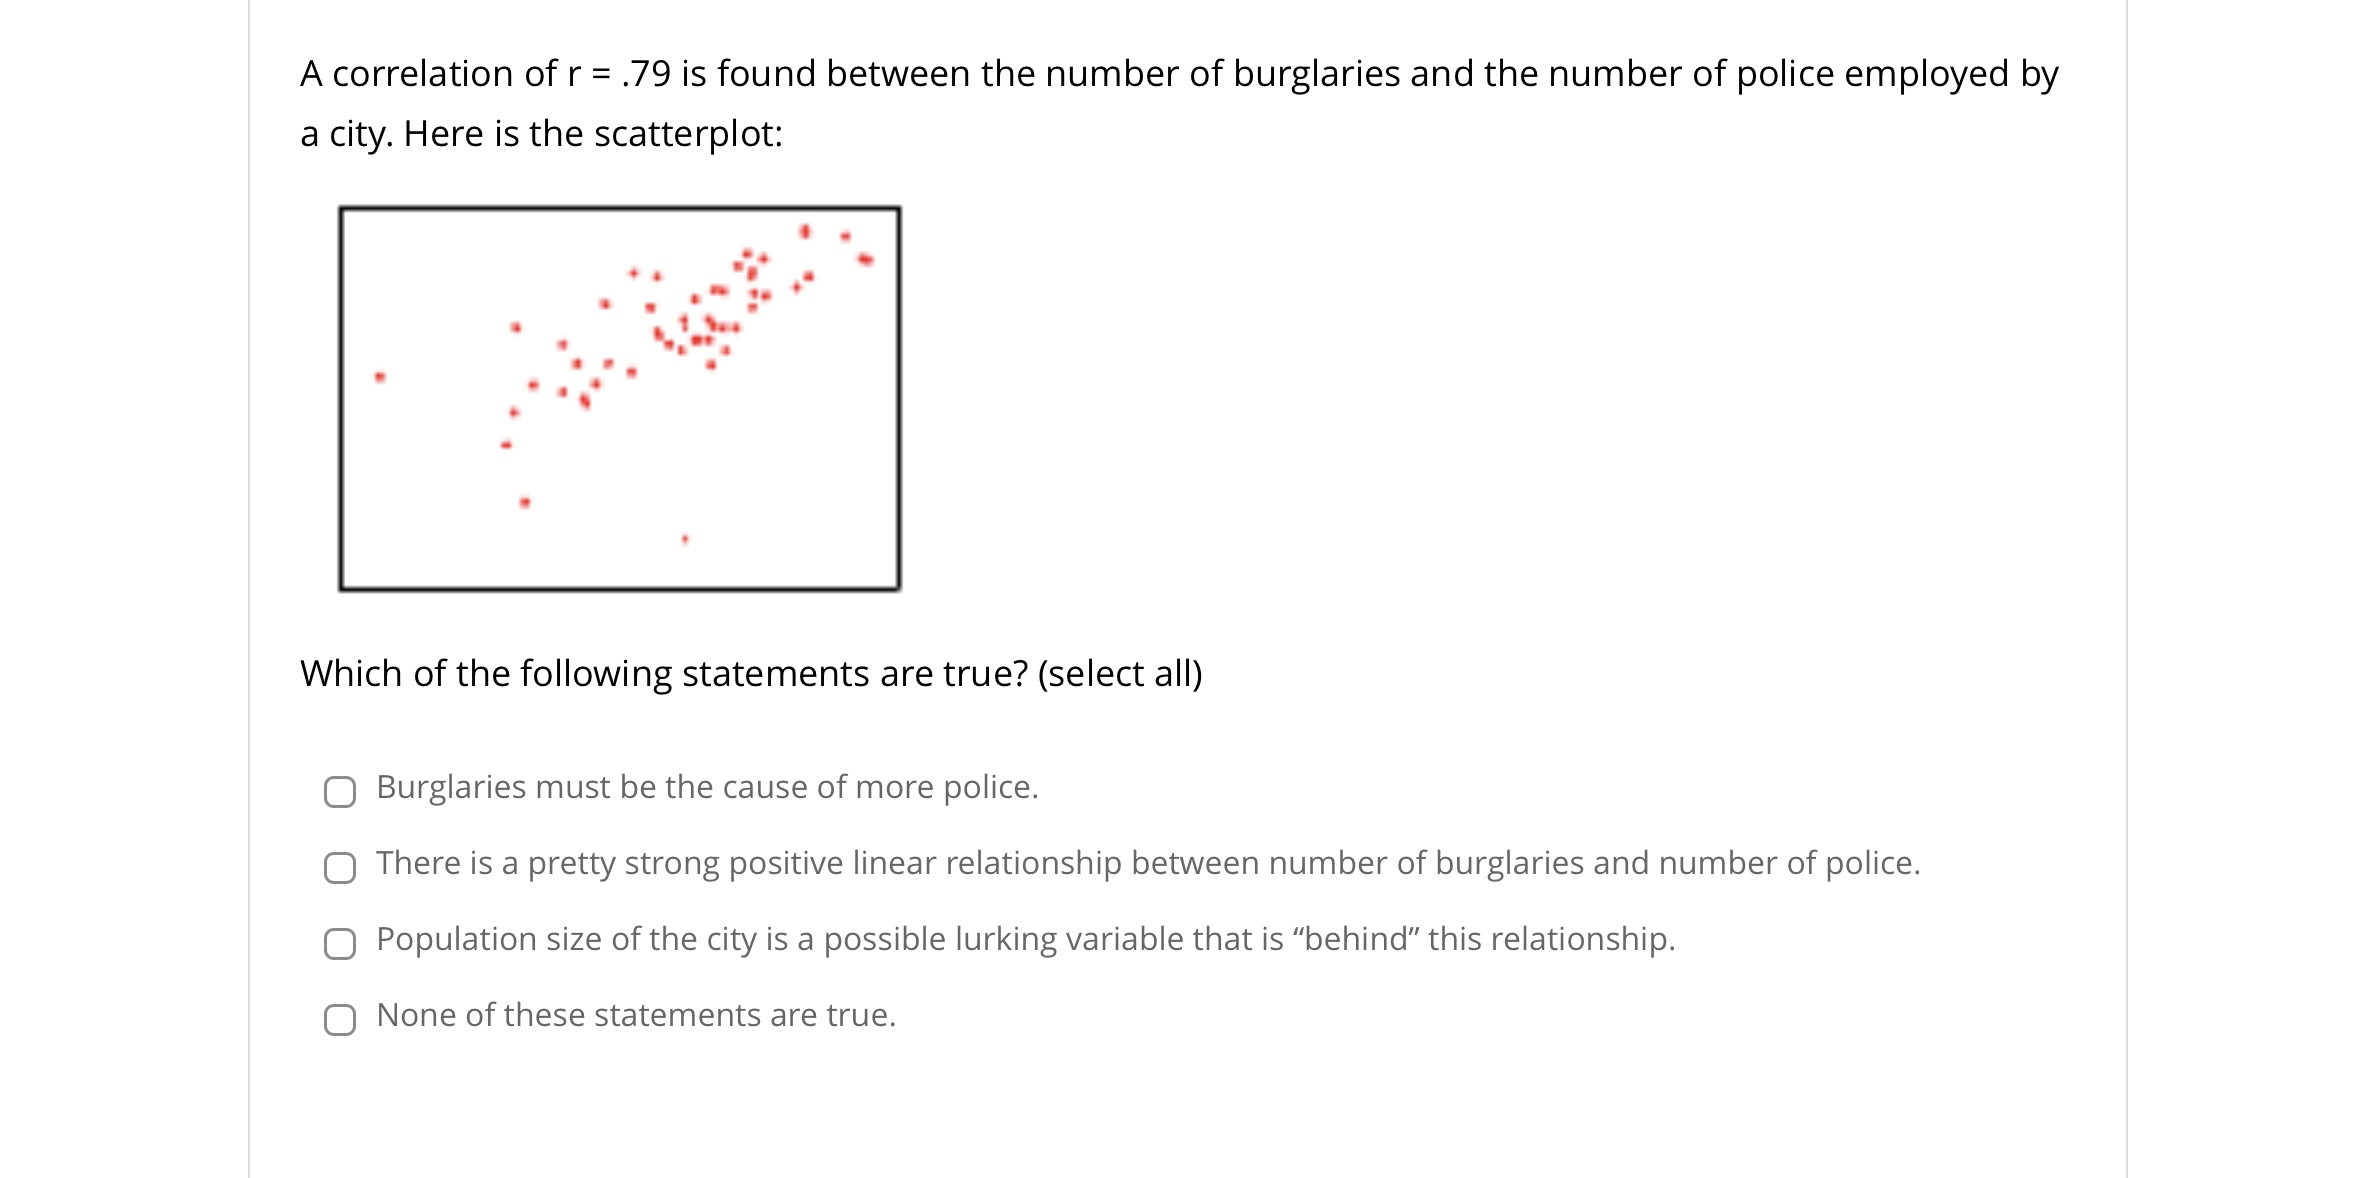
Question: A correlation of r = .79 is found between the number of burglaries and the number of police employed by a city. Here is the


![C] Burglaries must be the cause of more police. 0 There is](https://s3.amazonaws.com/si.experts.images/answers/2024/06/6679fc2abba52_4426679fc2a8b75b.jpg)

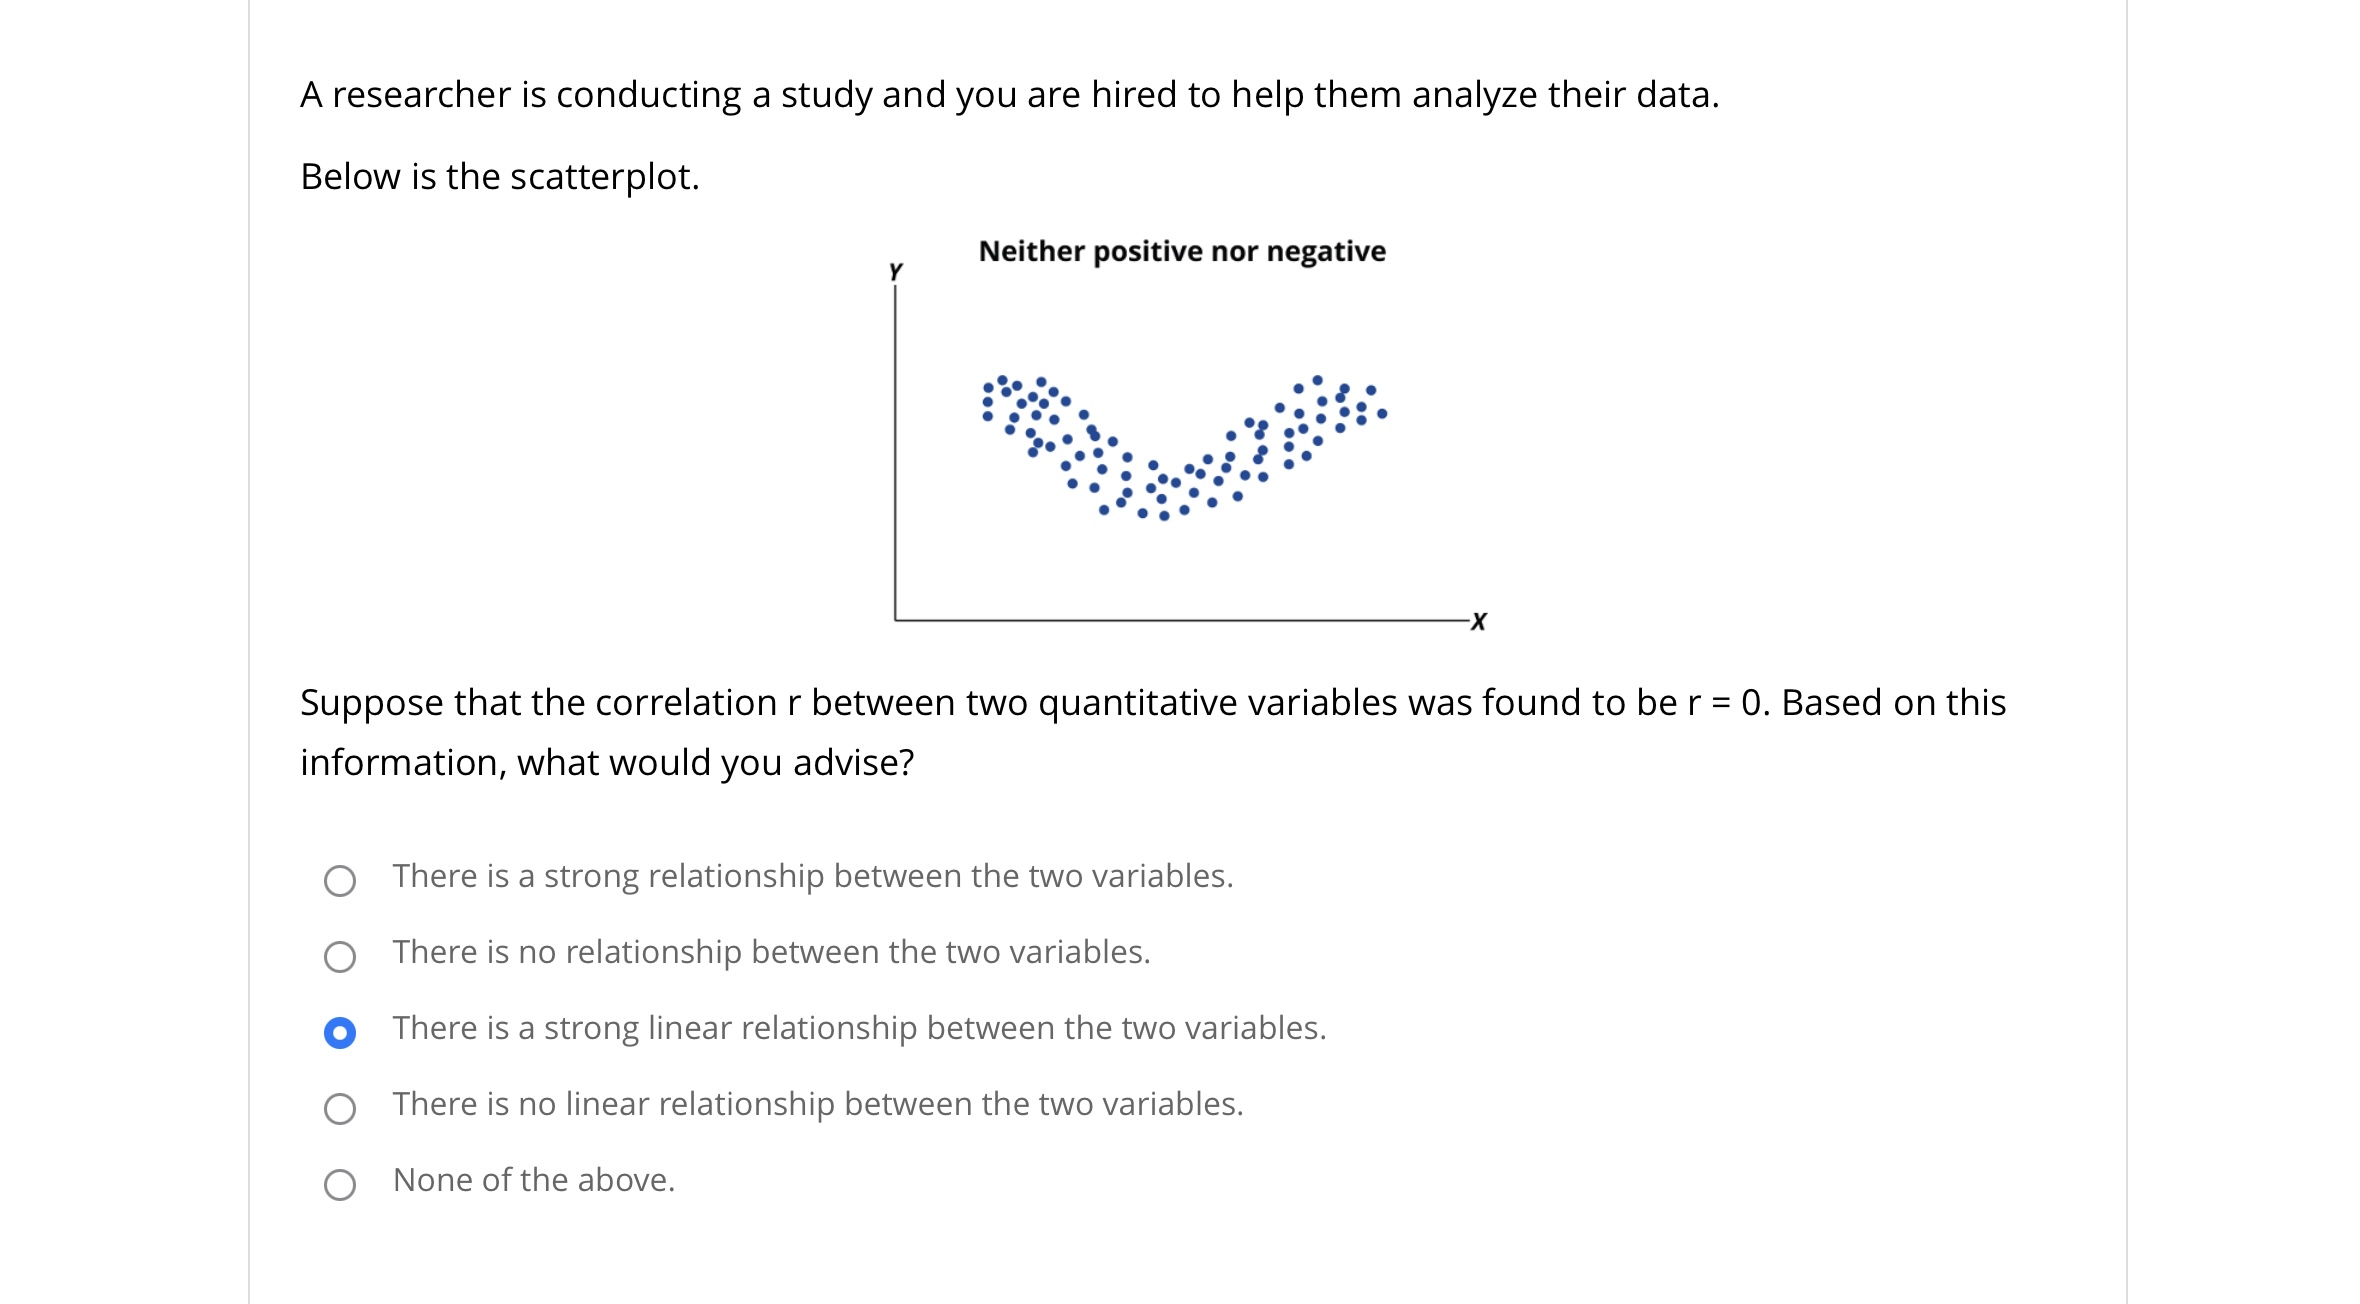
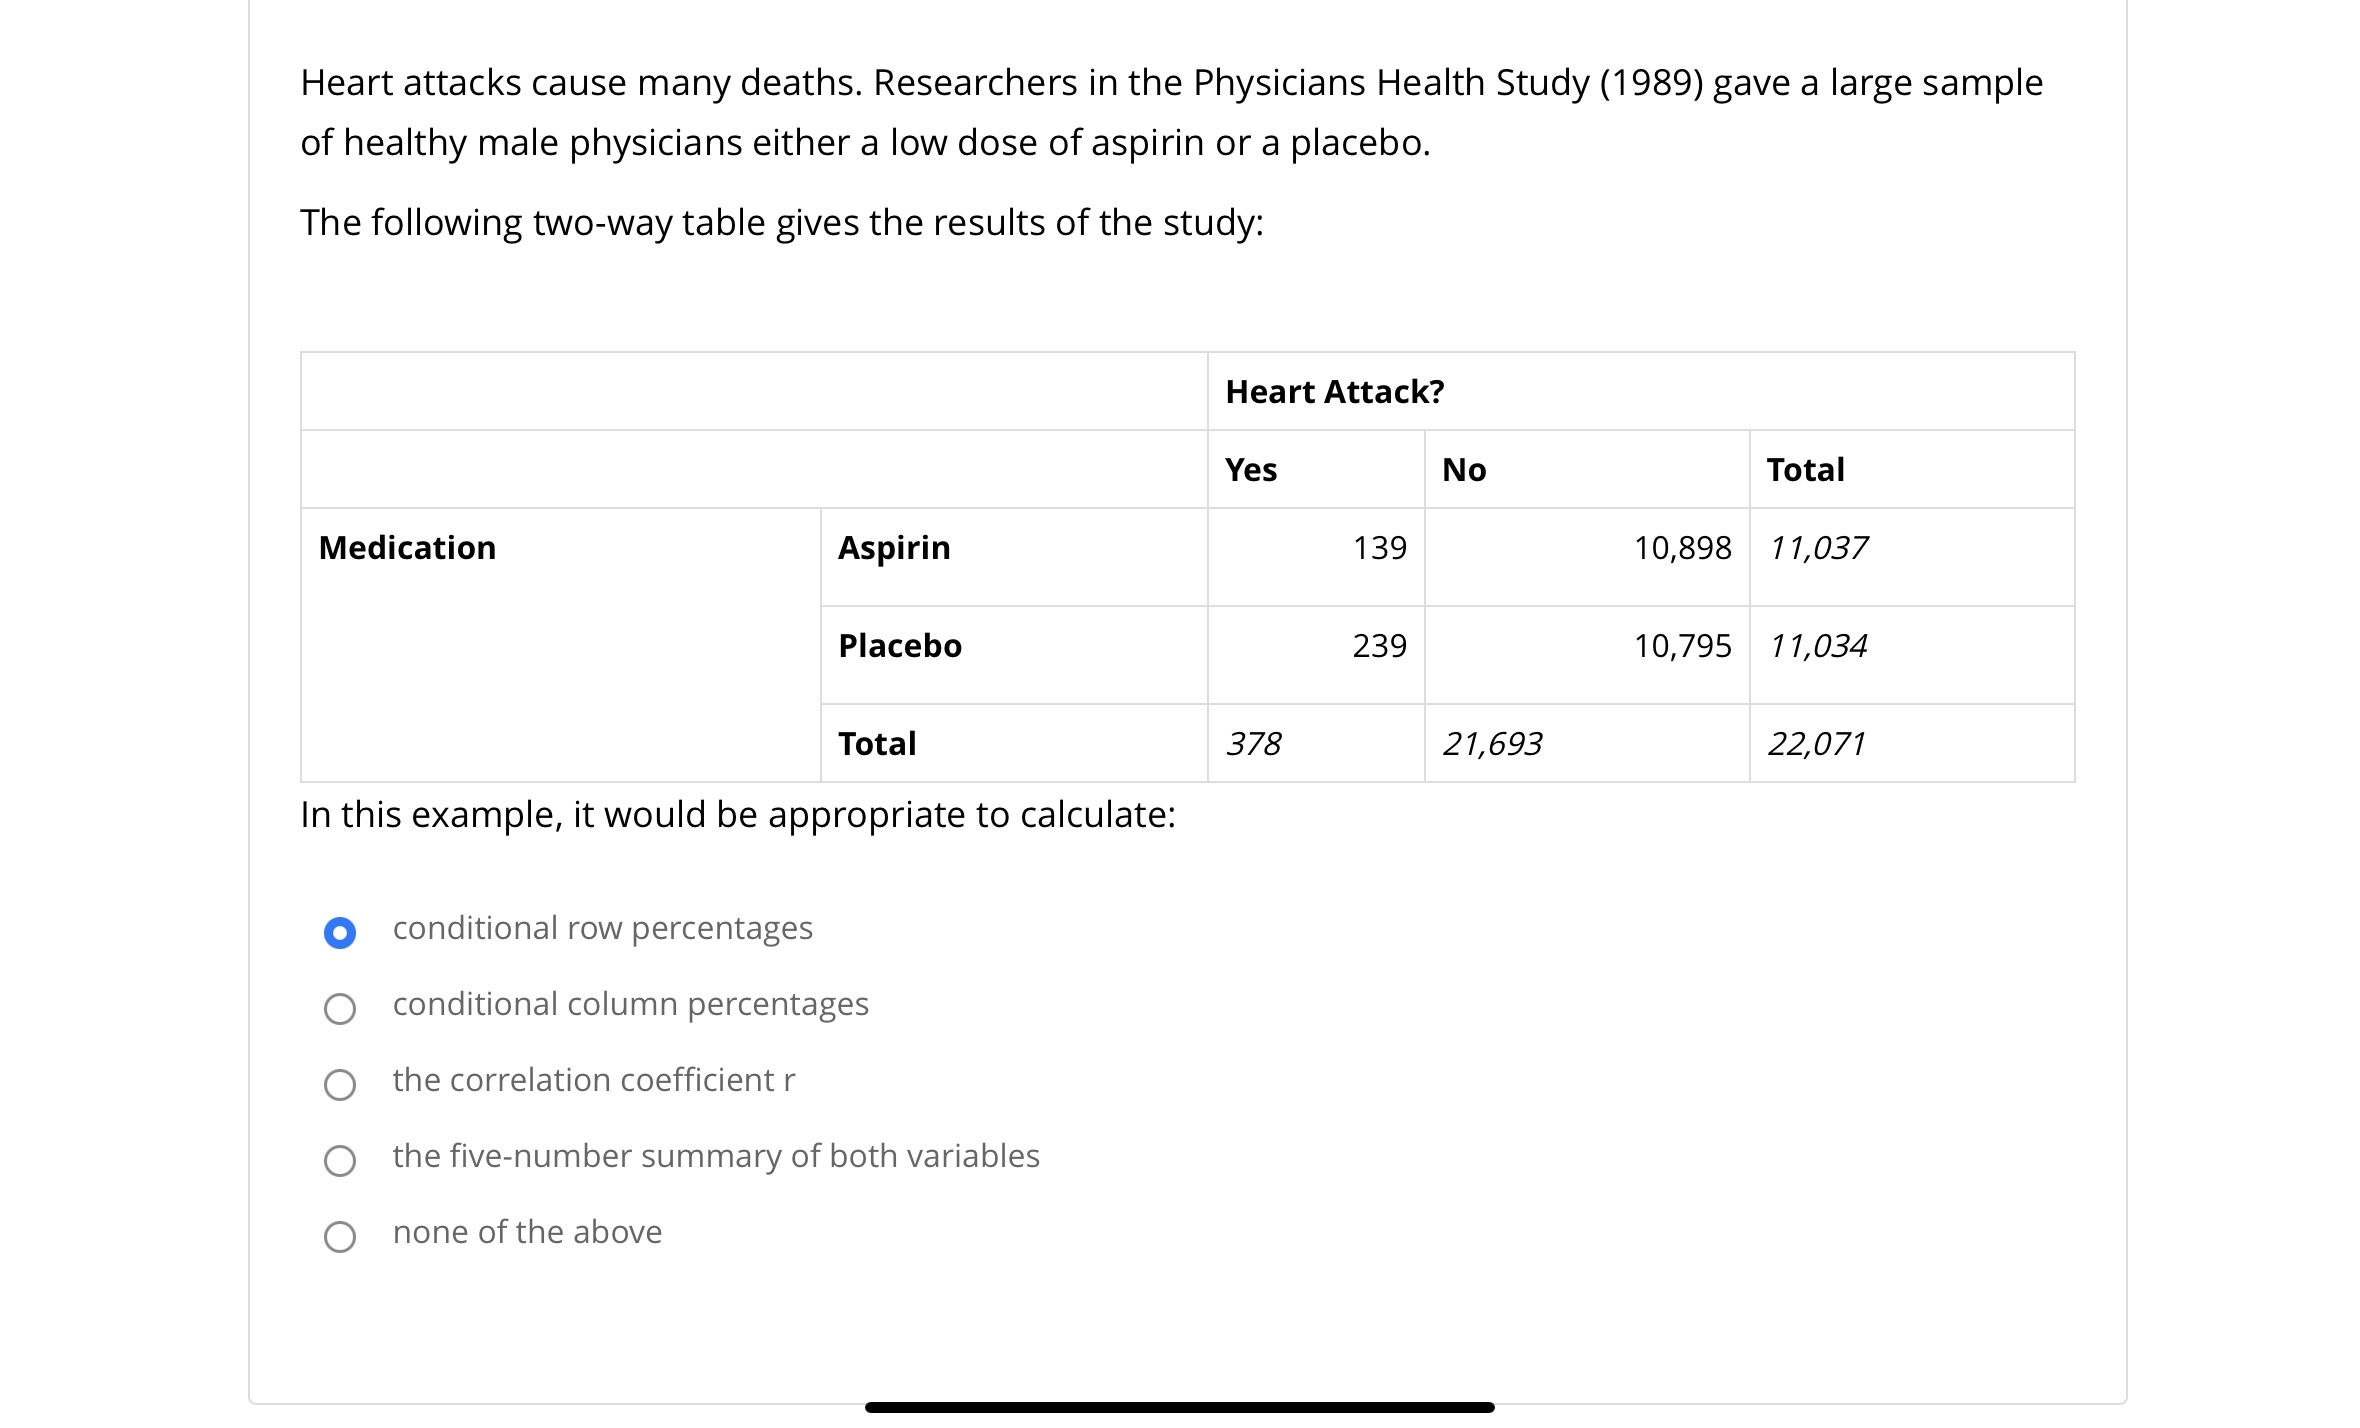
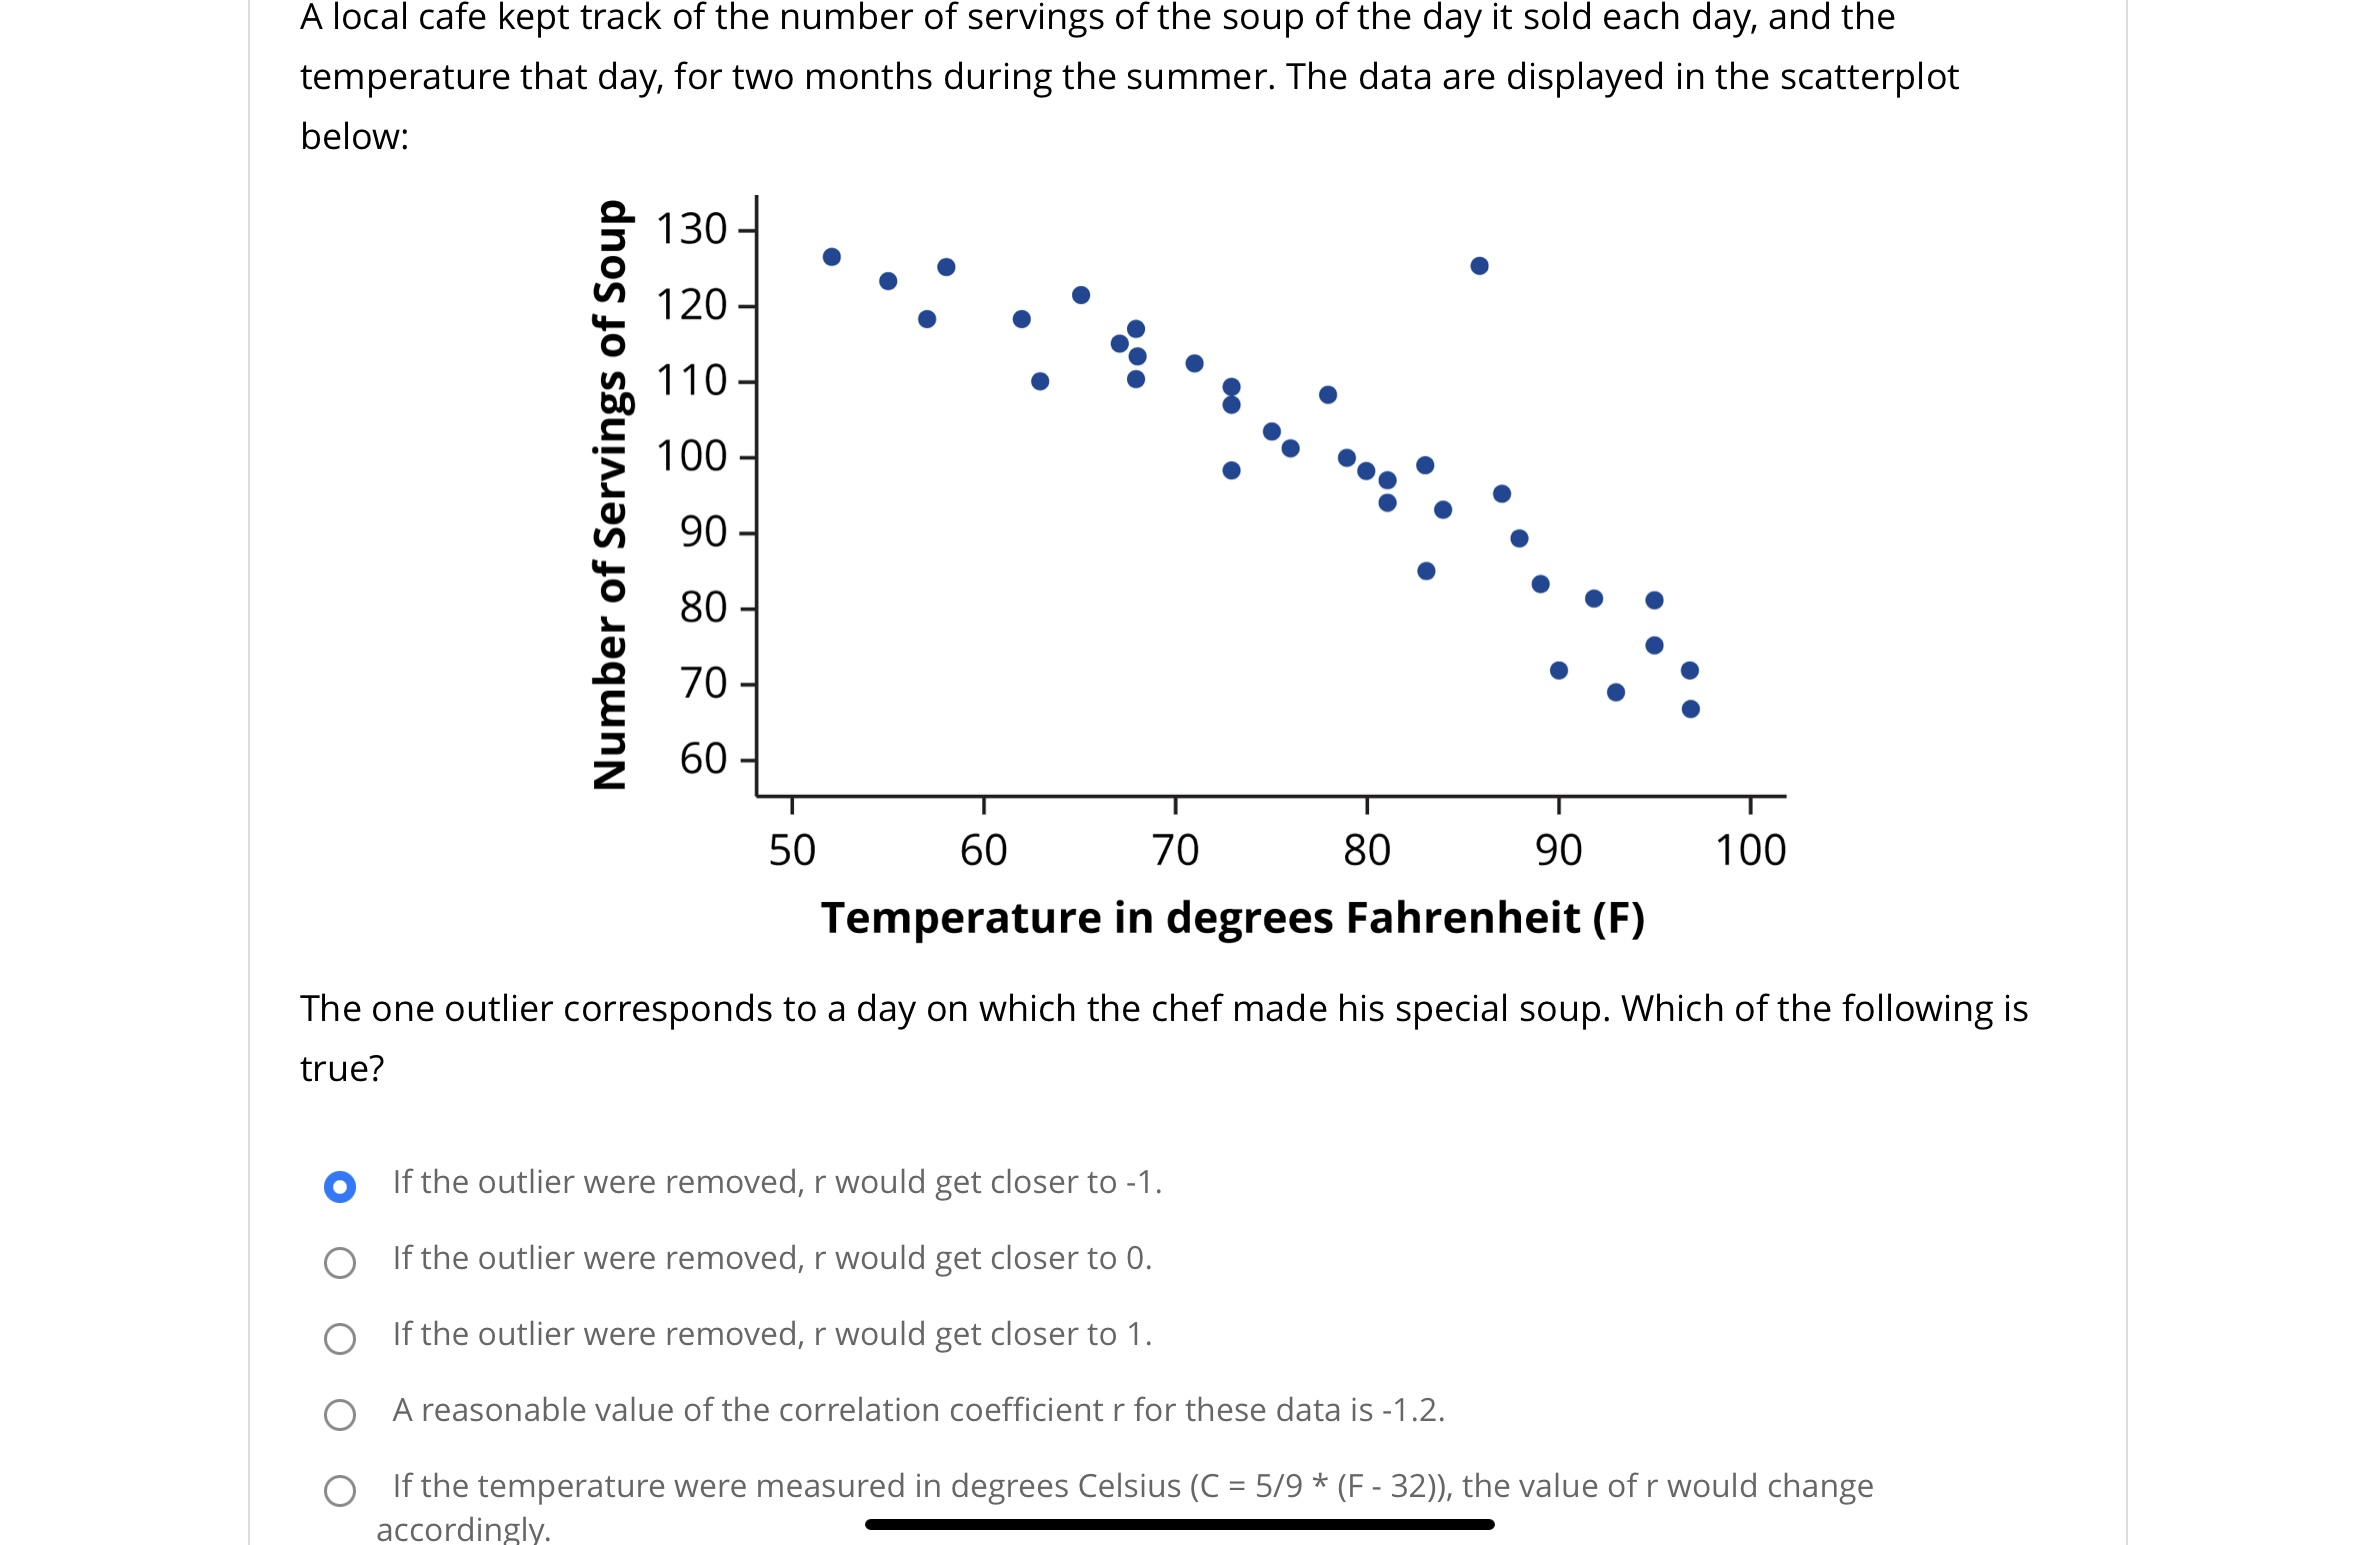


A correlation of r = .79 is found between the number of burglaries and the number of police employed by a city. Here is the scatterplot: Which of the following statements are true? (select all) C] Burglaries must be the cause of more police. 0 There is a pretty strong positive linear relationship between number of burglaries and number of police. 0 Population size of the city is a possible lurking variable that is \"behind" this relationship. 0 None of these statements are true. A researcher is conducting a study and you are hired to help them analyze their data. Below is the scatterplot. Neither positive nor negative Suppose that the correlation r between two quantitative variables was found to be r = 0. Based on this information, what would you advise? There is a strong relationship between the two variables. There is no relationship between the two variables. There is a strong linear relationship between the two variables. There is no linear relationship between the two variables. None of the above. OOOOO Heart attacks cause many deaths. Researchers in the Physicians Health Study (1989) gave a large sample of healthy male physicians either a low dose of aspirin or a placebo. The following two-way table gives the results of the study: Heart Attack? Yes No Total Medication Aspirin 139 10,898 77,037 Placebo 239 10,795 77,034 Total 378 27,693 22,077 In this example, it would be appropriate to calculate: conditional rovv percentages conditional column percentages the correlation coefficient r the five-number summary of both variables none of the above OOOOO A local cafe kept track of the number of servings of the soup of the day it sold each day, and the temperature that day, for two months during the summer. The data are displayed in the scatterplot below: 130 120 110- 100 Number of Servings of Soup 60 50 60 70 80 90 100 Temperature in degrees Fahrenheit (F) The one outlier corresponds to a day on which the chef made his special soup. Which of the following is true? If the outlier were removed, r would get closer to -1. If the outlier were removed, r would get closer to 0. If the outlier were removed, r would get closer to 1. O A reasonable value of the correlation coefficient r for these data is -1.2. O If the temperature were measured in degrees Celsius (C = 5/9 * (F - 32)), the value of r would change accordingly.A study was done on the timeliness of flights (on-time vs. delayed) of two major airlines: StatsAir and AirMedian. Data were collected over a period of time from five major cities and it was found that StatsAir does better overall (i.e., has a smaller percentage of delayed flights). However, in each of the five cities separately, AirMedian does better. Which of the following is correct? This situation is mathematically impossible. This is an example ofSimpson's Paradox. "City" is a lurking variable in this example. This is an example of a negative association between variables. OOOOO Both (B) and (C) are correct. What can we say about the relationship between the correlation r and the slope b of the least-squares line for the same set of data? r and b have the same sign (+ or -) both r and b always have values between 1 and 1 r is always larger than b the slope b is always equal to the square of the correlation r 00000 b is always larger than r
Step by Step Solution
There are 3 Steps involved in it

Get step-by-step solutions from verified subject matter experts