

Question: a. Create a Data Table that shows what happens to the Location 3 Weighted Factor Score as the Factor Weight for Proximity to market varies
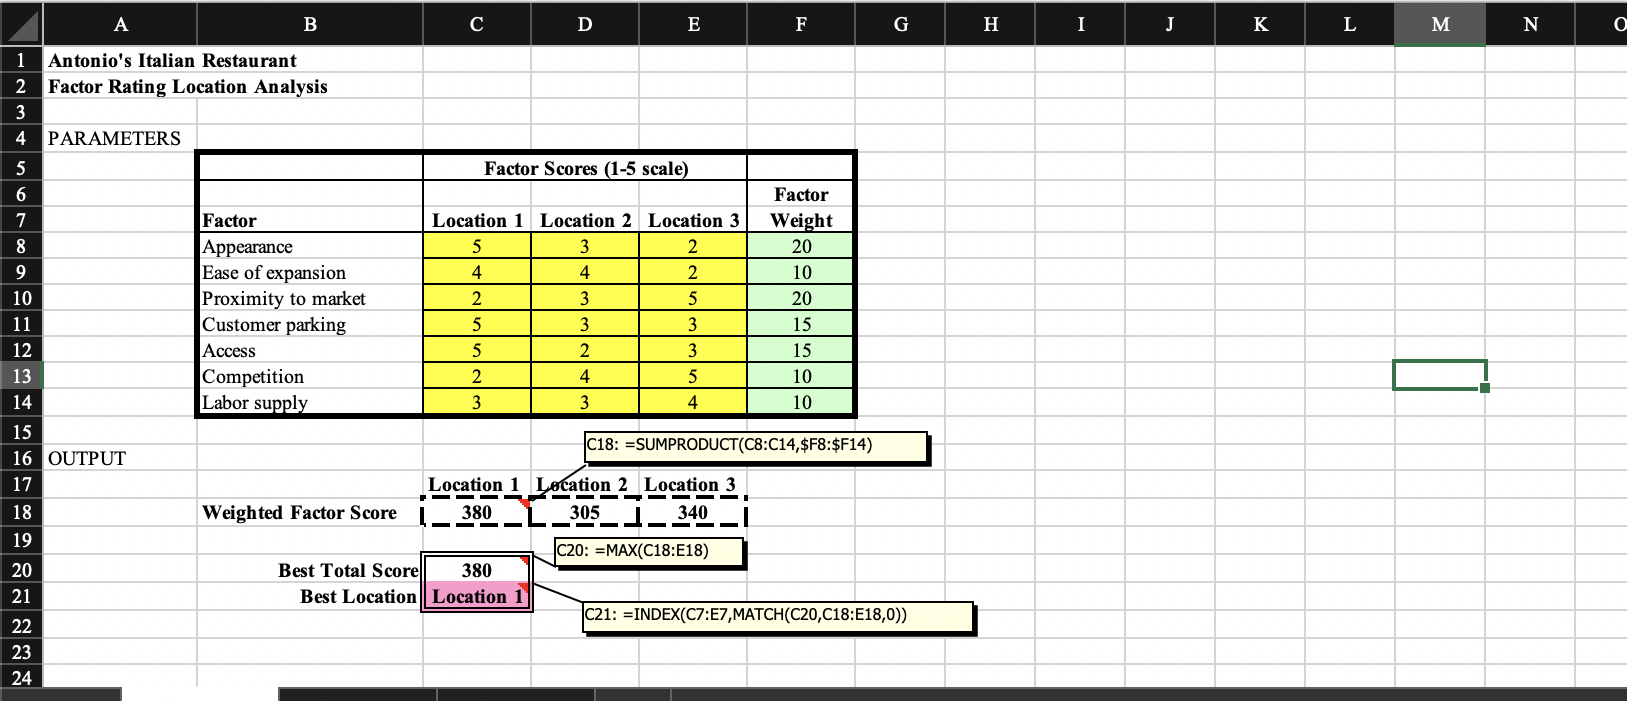
a. Create a Data Table that shows what happens to the Location 3 Weighted Factor Score as the Factor Weight for Proximity to market varies from 10 to 40, incrementing by 2 at a time.
b. Create a second Data Table that indicates the Best Location (from cell C21) as the Factor Weight for Proximity to market varies from 10 to 40, incrementing by 2 at a time. You should see the winning location change at some point.
A B D E F G H I J K L M N O 1 Antonio's Italian Restaurant Factor Rating Location Analysis 2 3 4 PARAMETERS 5 Factor Scores (1-5 scale) 6 7 8 9 10 11 12 13 14 Factor Appearance Ease of expansion Proximity to market Customer parking Access Competition Labor supply Location 1 Location 2 Location 3 5 3 2 4 4 2 2 3 5 5 3 3 5 2 3 2 4 5 3 3 4 Factor Weight 20 10 20 15 15 10 10 C18: =SUMPRODUCT(C8:C14,$F8:$F14) Location 1 Location 2 Location 3 380 305 340 Weighted Factor Score 15 16 OUTPUT 17 18 19 20 21 22 23 24 C20: =MAX(C18:E18) Best Total Score 380 Best Location Location 1 c21: =INDEX(C7:E7,MATCH(C20,C18:E18,0))Step by Step Solution
There are 3 Steps involved in it
1 Expert Approved Answer
Step: 1 Unlock

Question Has Been Solved by an Expert!
Get step-by-step solutions from verified subject matter experts
Step: 2 Unlock
Step: 3 Unlock