

Question: a) Create a scatterplot of the data above. b) Find and interpret the correlation coefficient. c) Find the LSRL. Use it to predict how many
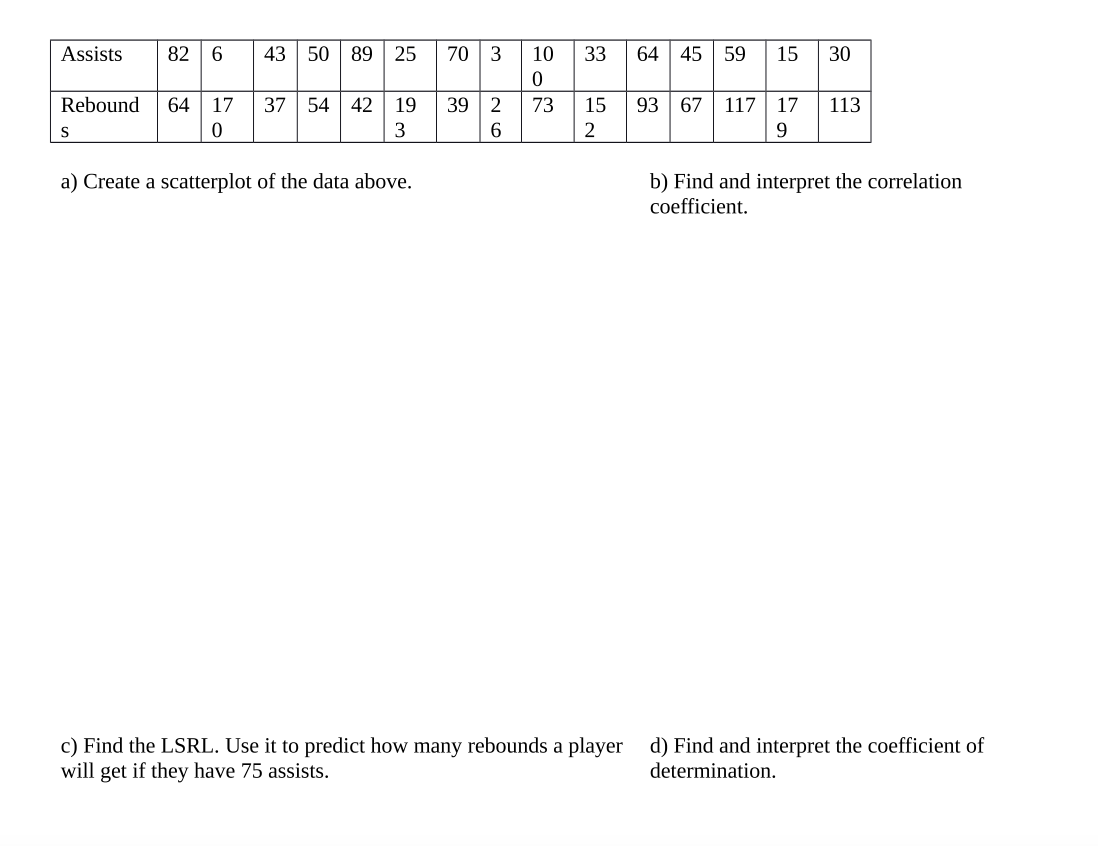

a) Create a scatterplot of the data above. b) Find and interpret the correlation coefficient. c) Find the LSRL. Use it to predict how many rebounds a player d) Find and interpret the coefficient of will get if they have 75 assists. determination
Step by Step Solution
There are 3 Steps involved in it
1 Expert Approved Answer
Step: 1 Unlock

Question Has Been Solved by an Expert!
Get step-by-step solutions from verified subject matter experts
Step: 2 Unlock
Step: 3 Unlock