

Question: a) Create a scatterplot of the final exam score (Y) versus the midterm score (X). Based on the visual evidence, would you say that the
a) Create a scatterplot of the final exam score (Y) versus the midterm score (X). Based on the visual evidence, would you say that the scores for the two exams are strongly related?
b) Superimpose a trend line on the scatterplot, and use the option to display the equation and the R2 value.
c) Run a regression using Excel to confirm the trend-line equation. Present your Regression table in your report.
d) What is your standard error of estimate? What does it say about predicting a student's final exam score from his or her midterm score?
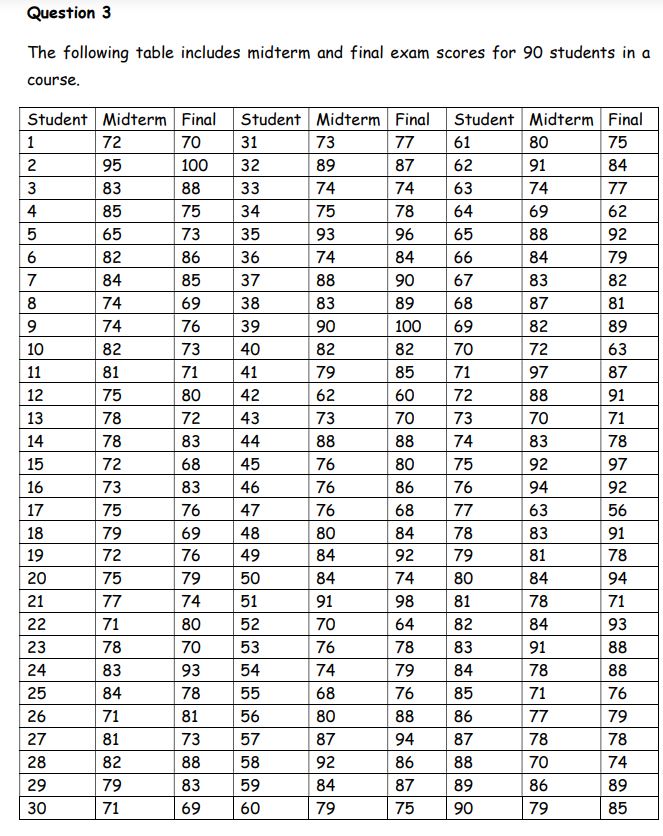
Question 3 The following table includes midterm and final exam scores for 90 students in a course. Student Midterm Student Midterm Student Midterm Final \\omHm-bwmh- E 11 12 13 14 15 16 17 13 19 20 21 22 23 24 25 26 27 23 29 30
Step by Step Solution
There are 3 Steps involved in it

Get step-by-step solutions from verified subject matter experts