

Question: a. Create a spreadsheet illustrating each employee's income/discount data considering the average of hours worked weekly calculated based on the period of six months (column
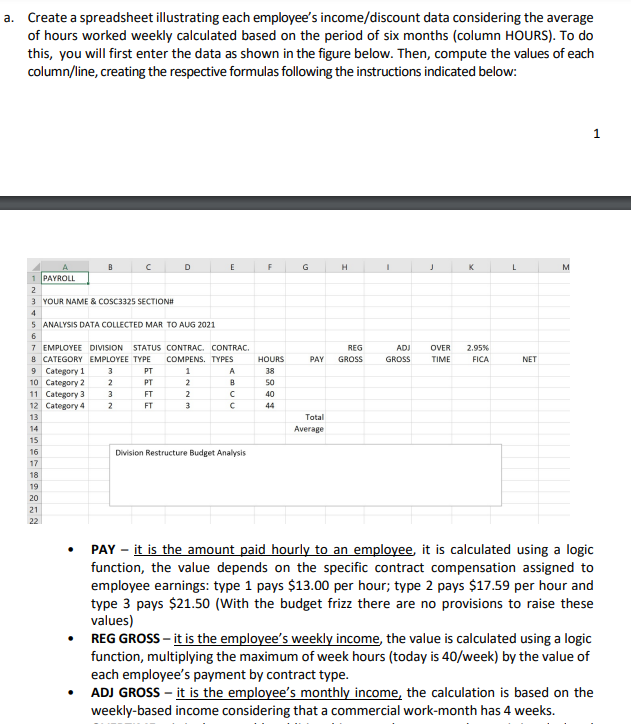
a. Create a spreadsheet illustrating each employee's income/discount data considering the average of hours worked weekly calculated based on the period of six months (column HOURS). To do this, you will first enter the data as shown in the figure below. Then, compute the values of each column/line, creating the respective formulas following the instructions indicated below: 1 F G . L M REG GROSS ADJ GROSS OVER TIME 2.95% FICA PAY NET D 1 PAYROLL 2 3 YOUR NAME & COSC3325 SECTION# 4 5 ANALYSIS DATA COLLECTED MAR TO AUG 2021 6 7 EMPLOYEE DIVISION STATUS CONTRAC. CONTRAC. 8 CATEGORY EMPLOYEE TYPE COMPENS. TYPES 9 Category 1 3 PT 1 A 10 Category 2 2 PT 2 B 11 Category 3 3 FT 2 C 12 Category 4 2 FT 3 C 13 14 15 16 Division Restructure Budget Analysis 17 18 HOURS 38 50 40 44 Total Average 19 20 21 22 . PAY - it is the amount paid hourly to an employee, it is calculated using a logic function, the value depends on the specific contract compensation assigned to employee earnings: type 1 pays $13.00 per hour; type 2 pays $17.59 per hour and type 3 pays $21.50 (With the budget frizz there are no provisions to raise these values) REG GROSS - it is the employee's weekly income the value is calculated using a logic function, multiplying the maximum of week hours (today is 40/week) by the value of each employee's payment by contract type. ADJ GROSS - it is the employee's monthly income, the calculation is based on the weekly-based income considering that a commercial work-month has 4 weeks. . OVERTIME it is the monthly additional income due to extra hours; it is calculated using a combination of logic functions, considering the assessment of employee's status type (FT or PT) and the calculation of the number of hours worked beyond the weekly maximum (40 hours): where a multiplication factor of 1.5 will be applied to the original paid amount of hour for PT employees; FT employees have a multiplication factor of 3. All employees will be assessed but only those who made more hours than the weekly maximum (40) will receive the extra income and the value will be presented in this column. Calculate the number of weekly work hours that exceed the maximum > 40), then multiply this value by the respective multiplication factor (PT=1.5; FT-3), also considering that a commercial work-month has 4 weeks. Use this guideline to calculate the monthly additional income considering that OVERTIME is based on the employee's contract compensation that is the number of hours shown in column PAY. FICA - calculate the monthly discount value on employee salary regarding the mandatory FICA contribution, based on the employee's monthly income showing in the ADJ GROSS column, exploiting the absolute addressing or absolute reference. The reference for the discount (percentage value) is expressed in the spreadsheet on top of the column label, it can change anytime. NET - it is the final employee's monthly income, it is the value on their paycheck, the employee salary, based on the values of monthly/additional incomes and discounts. Total and Average, compute the value using the respective excel functions it would show in all designated columns. b. Create a new column named EMPLOYEE CONTRACT COST, and make the calculation of how much costs the contract for each employee's category, it is calculated using a logic function, the value depends on the employee's monthly final salary showing in the NET column and the contract compensation to support employee's earnings: type A is related to 6 months contract; 2 type B is related to 9 months contract and type C is related to 12 months contract. This new column should be covered by Total and Average lines too; C. Create a new column named DIVISION CONTRACTS COST TOTAL, and calculate the value expressed on Employee Contract Cost and the number of division employees in each category. This new column should be covered by Total and Average lines too; d. Apply conditional format in the cells from column OVERTIME using the formula: highlight in Light Green Fill with Dark Green Text only the cells that hold values greater than $500 (if the employee does not earn OVERTIME income, the cell must stay plain, not highlighted). e. Create a three-dimensional bar chart illustrating the values earned regarding the respective Employee Category and the columns NET, EMPLOYEE CONTRACT COST, and DIVISION CONTRACT COST TOTAL. Add a title, the respective Data Table, and move the chart to a new sheet. f. A committee has been formed to discuss the company restructuring plan, reviewing the implementation of the budget committee recommendations for the cuts (executed in 2020 and 2021), the effects of the layoffs on divisions productivity, reviewing the budget cut plan prospect of 7% cut on divisions annual budget for the end of 2021, and the estimation for 2022. Considering the change in the company's perspective revenues due to the federal government fiscal help plan, the cuts expected should be equalized to respond to what was indeed verified 3.2% instead of 5% applied in the $ 550k annual budget in 2020 due to what was estimated for 2021. Insert a text box entitled Division's Restructuring Budget Analysis and you will present the assessment of employee's contracts costs, providing your division payroll analysis to guide the estimates for 2022 considering the impacts of these proposals (remember your analysis is based on the average of hours worked for each employee category verified during six months): 1) implement NO layoffs in 2021 (keeping the current number of employees) or 2) implement only a 10% staff layoff against the recommended the original cut plan for 2021 and 3) justify the recomposition of the division's budget in 2% as Emergency Fund. You should briefly describe the argumentation to support each proposal, based on the analysis of the data, highlighting potential pros/cons in a short time of each scenario and the implications for each proposal on retention of employees, division's productivity, company's competitiveness, and future profit/investments expense, especially the defense of the division's budget recomposition in 2% Emergency Fund. Correlate the spreadsheet data and each chart bar to illustrate your findings and suggestions narrative. g. Apply professional design in the spreadsheet: labels, formats, colors, and backgrounds to better present your data and the chart (it should be colorful but still in a professional way). h. Save the file and named your file as Assignment2 - FullName - 1 point penalty for not follow the required file name format. a. Create a spreadsheet illustrating each employee's income/discount data considering the average of hours worked weekly calculated based on the period of six months (column HOURS). To do this, you will first enter the data as shown in the figure below. Then, compute the values of each column/line, creating the respective formulas following the instructions indicated below: 1 F G . L M REG GROSS ADJ GROSS OVER TIME 2.95% FICA PAY NET D 1 PAYROLL 2 3 YOUR NAME & COSC3325 SECTION# 4 5 ANALYSIS DATA COLLECTED MAR TO AUG 2021 6 7 EMPLOYEE DIVISION STATUS CONTRAC. CONTRAC. 8 CATEGORY EMPLOYEE TYPE COMPENS. TYPES 9 Category 1 3 PT 1 A 10 Category 2 2 PT 2 B 11 Category 3 3 FT 2 C 12 Category 4 2 FT 3 C 13 14 15 16 Division Restructure Budget Analysis 17 18 HOURS 38 50 40 44 Total Average 19 20 21 22 . PAY - it is the amount paid hourly to an employee, it is calculated using a logic function, the value depends on the specific contract compensation assigned to employee earnings: type 1 pays $13.00 per hour; type 2 pays $17.59 per hour and type 3 pays $21.50 (With the budget frizz there are no provisions to raise these values) REG GROSS - it is the employee's weekly income the value is calculated using a logic function, multiplying the maximum of week hours (today is 40/week) by the value of each employee's payment by contract type. ADJ GROSS - it is the employee's monthly income, the calculation is based on the weekly-based income considering that a commercial work-month has 4 weeks. . OVERTIME it is the monthly additional income due to extra hours; it is calculated using a combination of logic functions, considering the assessment of employee's status type (FT or PT) and the calculation of the number of hours worked beyond the weekly maximum (40 hours): where a multiplication factor of 1.5 will be applied to the original paid amount of hour for PT employees; FT employees have a multiplication factor of 3. All employees will be assessed but only those who made more hours than the weekly maximum (40) will receive the extra income and the value will be presented in this column. Calculate the number of weekly work hours that exceed the maximum > 40), then multiply this value by the respective multiplication factor (PT=1.5; FT-3), also considering that a commercial work-month has 4 weeks. Use this guideline to calculate the monthly additional income considering that OVERTIME is based on the employee's contract compensation that is the number of hours shown in column PAY. FICA - calculate the monthly discount value on employee salary regarding the mandatory FICA contribution, based on the employee's monthly income showing in the ADJ GROSS column, exploiting the absolute addressing or absolute reference. The reference for the discount (percentage value) is expressed in the spreadsheet on top of the column label, it can change anytime. NET - it is the final employee's monthly income, it is the value on their paycheck, the employee salary, based on the values of monthly/additional incomes and discounts. Total and Average, compute the value using the respective excel functions it would show in all designated columns. b. Create a new column named EMPLOYEE CONTRACT COST, and make the calculation of how much costs the contract for each employee's category, it is calculated using a logic function, the value depends on the employee's monthly final salary showing in the NET column and the contract compensation to support employee's earnings: type A is related to 6 months contract; 2 type B is related to 9 months contract and type C is related to 12 months contract. This new column should be covered by Total and Average lines too; C. Create a new column named DIVISION CONTRACTS COST TOTAL, and calculate the value expressed on Employee Contract Cost and the number of division employees in each category. This new column should be covered by Total and Average lines too; d. Apply conditional format in the cells from column OVERTIME using the formula: highlight in Light Green Fill with Dark Green Text only the cells that hold values greater than $500 (if the employee does not earn OVERTIME income, the cell must stay plain, not highlighted). e. Create a three-dimensional bar chart illustrating the values earned regarding the respective Employee Category and the columns NET, EMPLOYEE CONTRACT COST, and DIVISION CONTRACT COST TOTAL. Add a title, the respective Data Table, and move the chart to a new sheet. f. A committee has been formed to discuss the company restructuring plan, reviewing the implementation of the budget committee recommendations for the cuts (executed in 2020 and 2021), the effects of the layoffs on divisions productivity, reviewing the budget cut plan prospect of 7% cut on divisions annual budget for the end of 2021, and the estimation for 2022. Considering the change in the company's perspective revenues due to the federal government fiscal help plan, the cuts expected should be equalized to respond to what was indeed verified 3.2% instead of 5% applied in the $ 550k annual budget in 2020 due to what was estimated for 2021. Insert a text box entitled Division's Restructuring Budget Analysis and you will present the assessment of employee's contracts costs, providing your division payroll analysis to guide the estimates for 2022 considering the impacts of these proposals (remember your analysis is based on the average of hours worked for each employee category verified during six months): 1) implement NO layoffs in 2021 (keeping the current number of employees) or 2) implement only a 10% staff layoff against the recommended the original cut plan for 2021 and 3) justify the recomposition of the division's budget in 2% as Emergency Fund. You should briefly describe the argumentation to support each proposal, based on the analysis of the data, highlighting potential pros/cons in a short time of each scenario and the implications for each proposal on retention of employees, division's productivity, company's competitiveness, and future profit/investments expense, especially the defense of the division's budget recomposition in 2% Emergency Fund. Correlate the spreadsheet data and each chart bar to illustrate your findings and suggestions narrative. g. Apply professional design in the spreadsheet: labels, formats, colors, and backgrounds to better present your data and the chart (it should be colorful but still in a professional way). h. Save the file and named your file as Assignment2 - FullName - 1 point penalty for not follow the required file name format
Step by Step Solution
There are 3 Steps involved in it

Get step-by-step solutions from verified subject matter experts