

Question: A. Create the Descriptive Statistics for Price and SQFT - Include a 95% Confidence Test on the Population Mean B. Produce a Scatterplot for Price
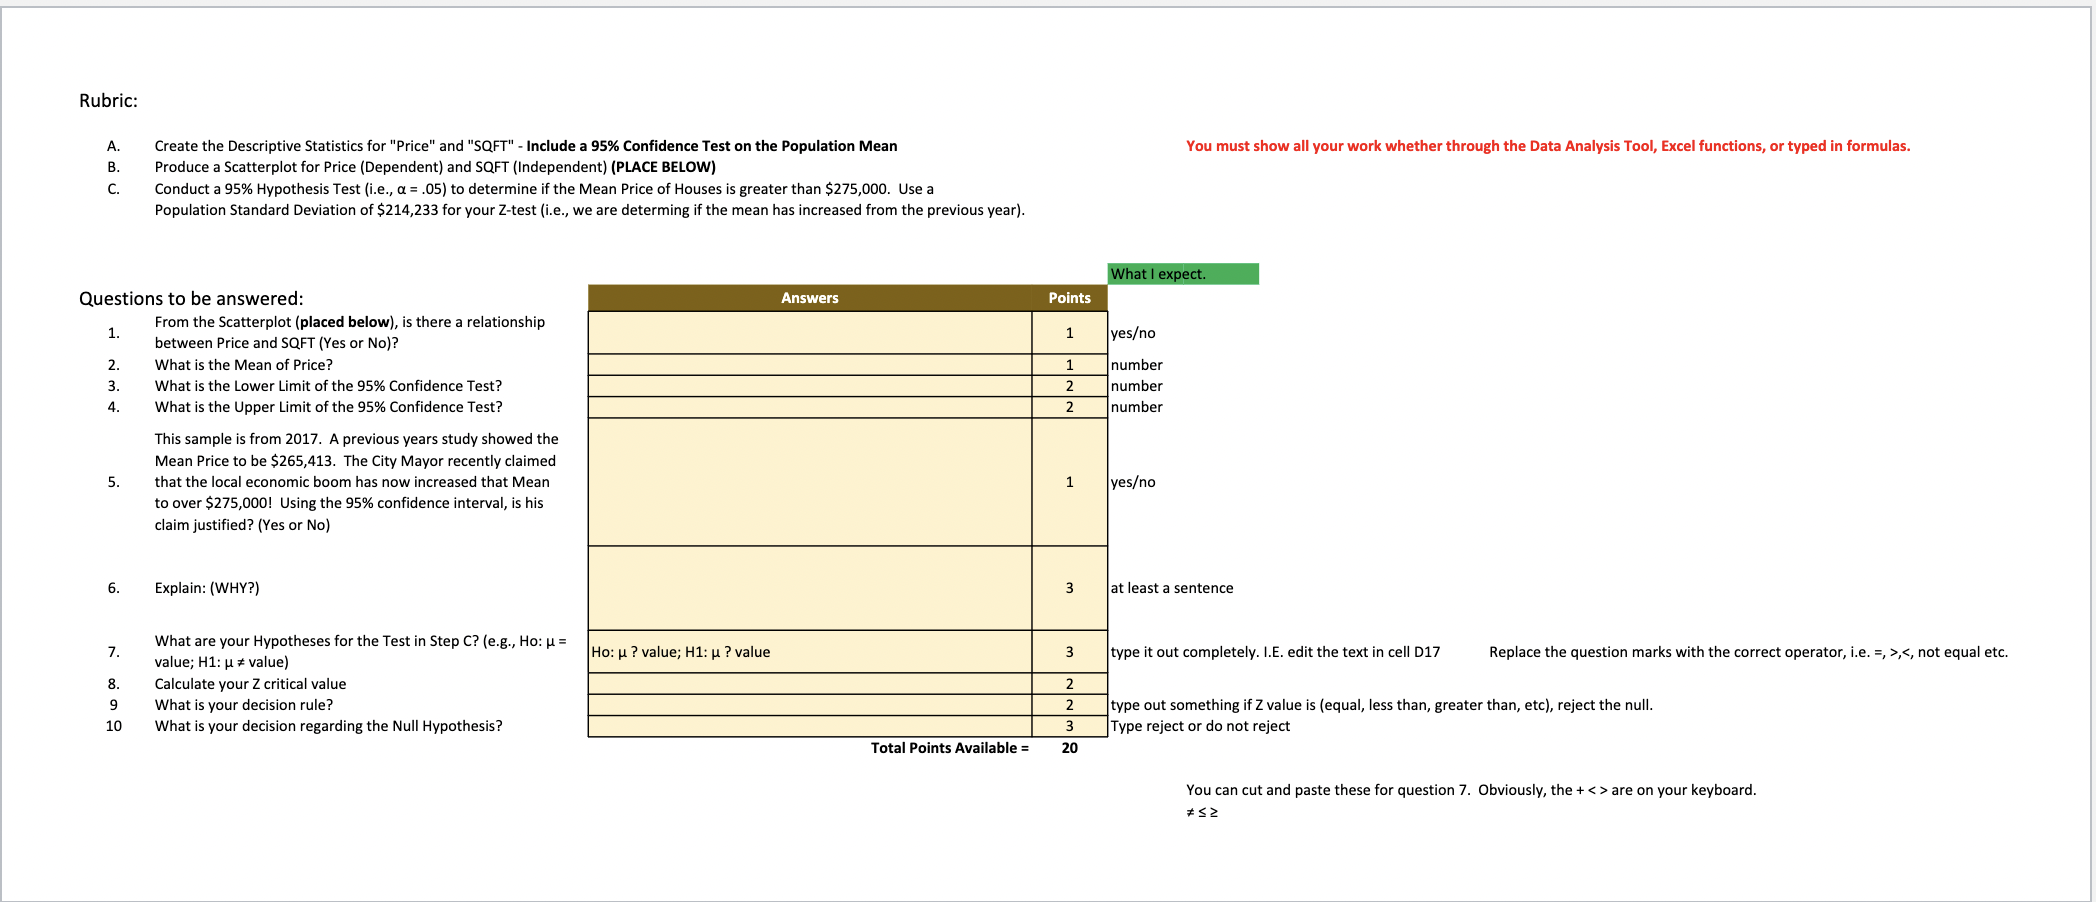
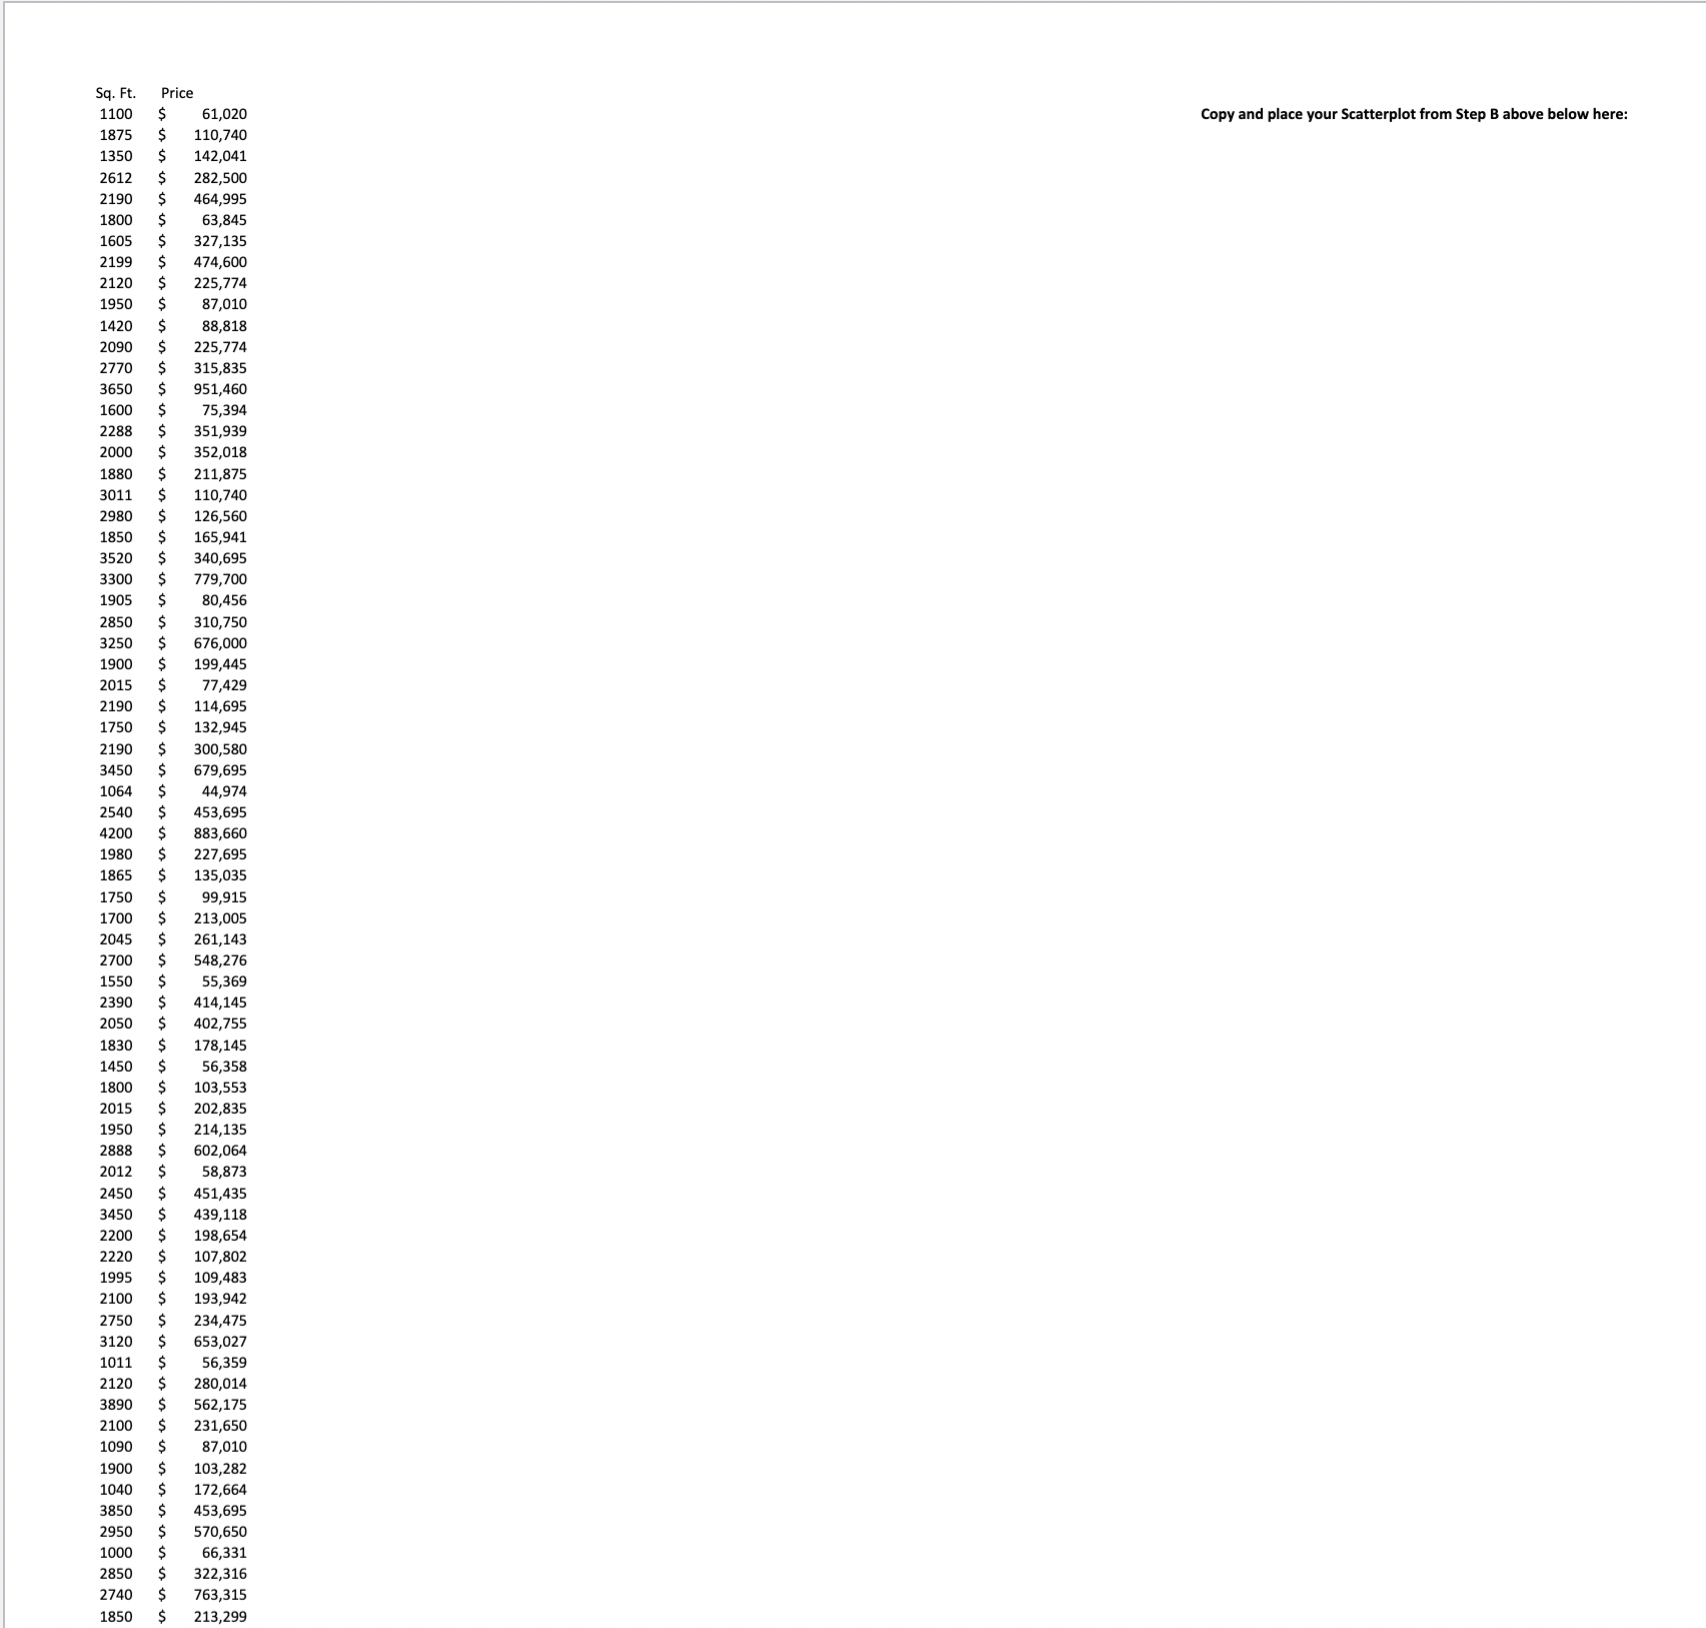
A. Create the Descriptive Statistics for "Price" and "SQFT" - Include a 95\% Confidence Test on the Population Mean B. Produce a Scatterplot for Price (Dependent) and SQFT (Independent) (PLACE BELOW) C. Conduct a 95% Hypothesis Test (i.e., =.05 ) to determine if the Mean Price of Houses is greater than $275,000. Use a Population Standard Deviation of $214,233 for your Z-test (i.e., we are determing if the mean has increased from the previous year). You must show all your work whether through the Data Analysis Tool, Excel functions, or typed in formulas. Questions to be answered: lect. 1. From the Scatterplot (placed below), is there a relationship 1. between Price and SQFT (Yes or No)? 2. What is the Mean of Price? 3. What is the Lower Limit of the 95% Confidence Test? 4. What is the Upper Limit of the 95% Confidence Test? This sample is from 2017. A previous years study showed the Mean Price to be $265,413. The City Mayor recently claimed 5. that the local economic boom has now increased that Mean to over $275,000 ! Using the 95% confidence interval, is his claim justified? (Yes or No) 6. Explain: (WHY?) ientence 7. What are your Hypotheses for the Test in Step C? (e.g., Ho: = value; H1:= value) 8. Calculate your Z critical value 9 What is your decision rule? 10 What is your decision regarding the Null Hypothesis? completely. I.E. edit the text in cell D mething if Z value is (equal, less than, greater than, etc), reject the null. t or do not reject Copy and place your Scatterplot from Step B above below here
Step by Step Solution
There are 3 Steps involved in it

Get step-by-step solutions from verified subject matter experts