

Question: ( a ) Curves a , b , c , d , and e on the logC - pH diagram represent the relationship between logC
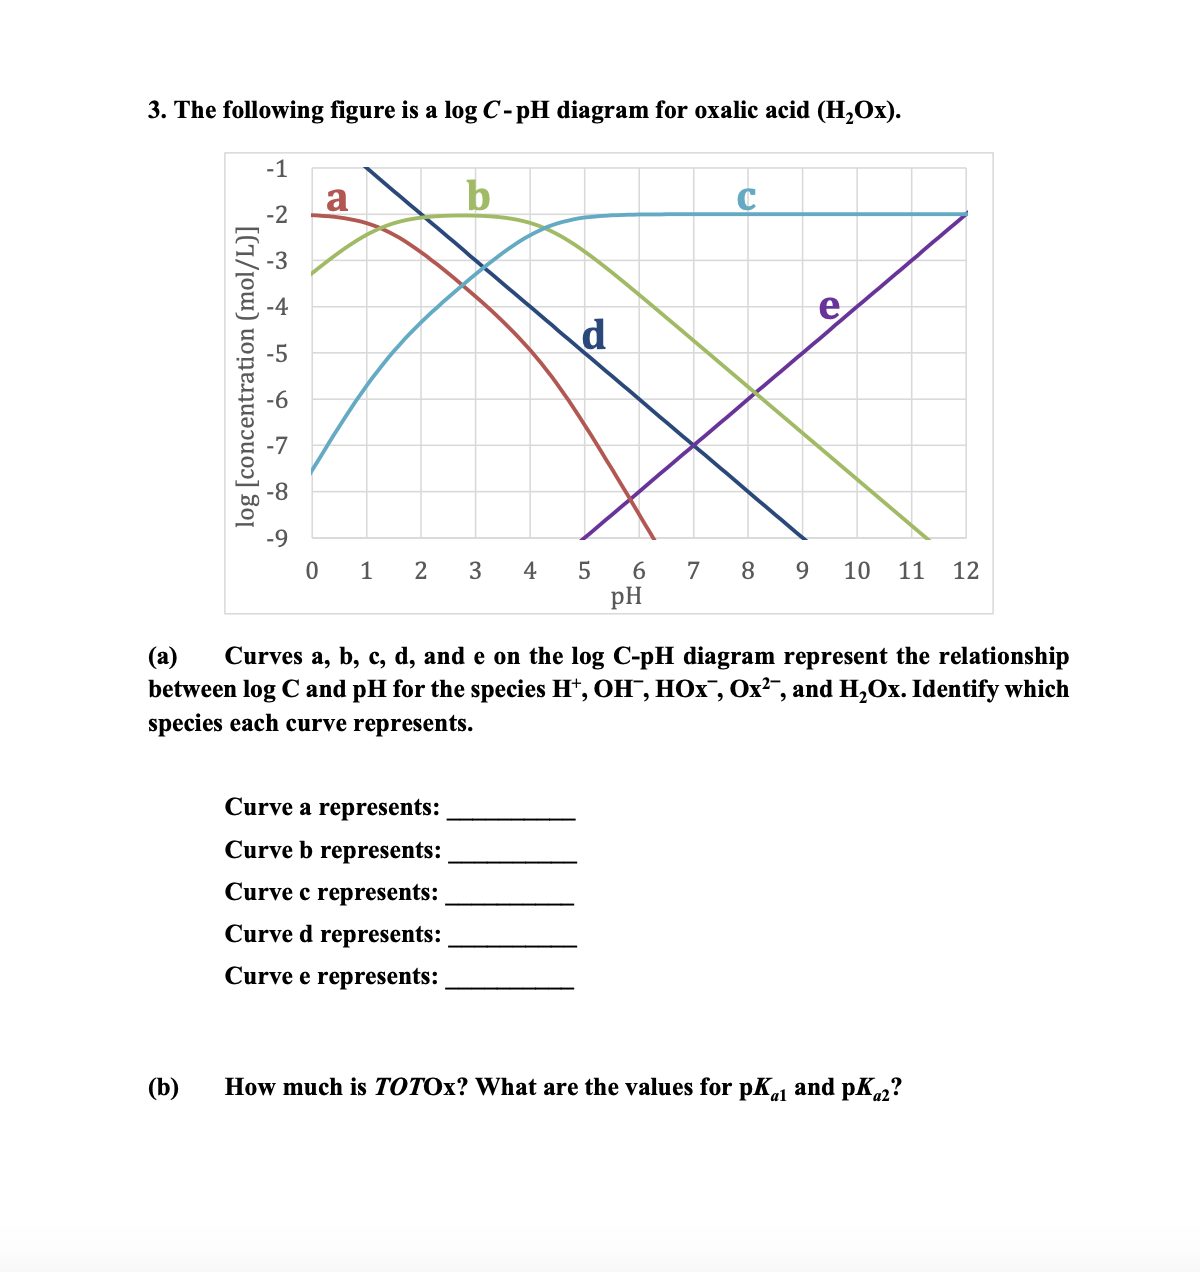
a Curves a b c d and e on the logCpH diagram represent the relationship between logC and pH for the species HOHHOxOx and HOx Identify which species each curve represents.
Curve a represents:
Curve b represents:
Curve c represents:
Curve d represents:
Curve e represents:
b How much is TOTOx? What are the values for pKa and pKa
species tableau and input species tableau as shown below with HOHHOxand
Naas the components, and write the corresponding TOTH equation. Briefly explain
sentences how you will use the TOTH equation to determine the solution pH
Eq c For a solution with MNaHOx added to water, complete the equilibrium
species tableau and input species tableau as shown below with and
as the components, and write the corresponding TOTH equation. Briefly explain
sentences how you will use the TOTH equation to determine the solution pH
Step by Step Solution
There are 3 Steps involved in it
1 Expert Approved Answer
Step: 1 Unlock

Question Has Been Solved by an Expert!
Get step-by-step solutions from verified subject matter experts
Step: 2 Unlock
Step: 3 Unlock