

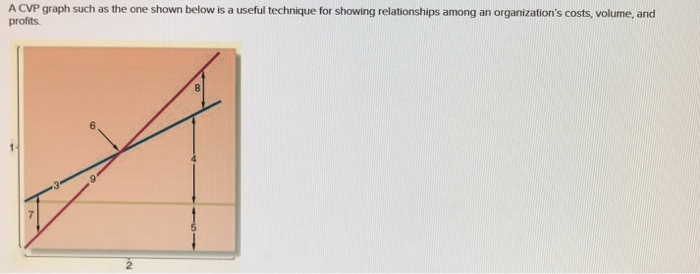
Question: A CVP graph such as the one shown below is a useful technique for showing relationships among an organization's costs, volume, and profits 6 2

A CVP graph such as the one shown below is a useful technique for showing relationships among an organization's costs, volume, and profits 6 2 d. Two thousand more units are sold during the period than were budgeted e. Due to paying salespersons a commission rather than a flat salary, fixed expenses are reduced by $8,000 per period and unit variable expenses are increased by $3 f Due to an increase in the cost of materials, both unit variable expenses and the selling price are increased by $2 g. Advertising costs are increased by $10,000 per period, resulting in a 10% increase in the number of units sold. h. Due to automating an operation previously done by workers, fixed expenses are increased by $12,000 per period and unit variable expenses are reduced by $4 A CVP graph such as the one shown below is a useful technique for showing relationships among an organization's costs, volume, and profits 6 2 d. Two thousand more units are sold during the period than were budgeted e. Due to paying salespersons a commission rather than a flat salary, fixed expenses are reduced by $8,000 per period and unit variable expenses are increased by $3 f Due to an increase in the cost of materials, both unit variable expenses and the selling price are increased by $2 g. Advertising costs are increased by $10,000 per period, resulting in a 10% increase in the number of units sold. h. Due to automating an operation previously done by workers, fixed expenses are increased by $12,000 per period and unit variable expenses are reduced by $4
Step by Step Solution
There are 3 Steps involved in it
To analyze the effects of the changes mentioned using a CostVolumeProfit CVP graph lets break down each scenario a Two thousand more units are sold du... View full answer

Get step-by-step solutions from verified subject matter experts