

Question: A D E 1 Observation Number Obs 2 1 3 2 4 3 5 OWN 4 6 5 7 6 8 7 9 10 11
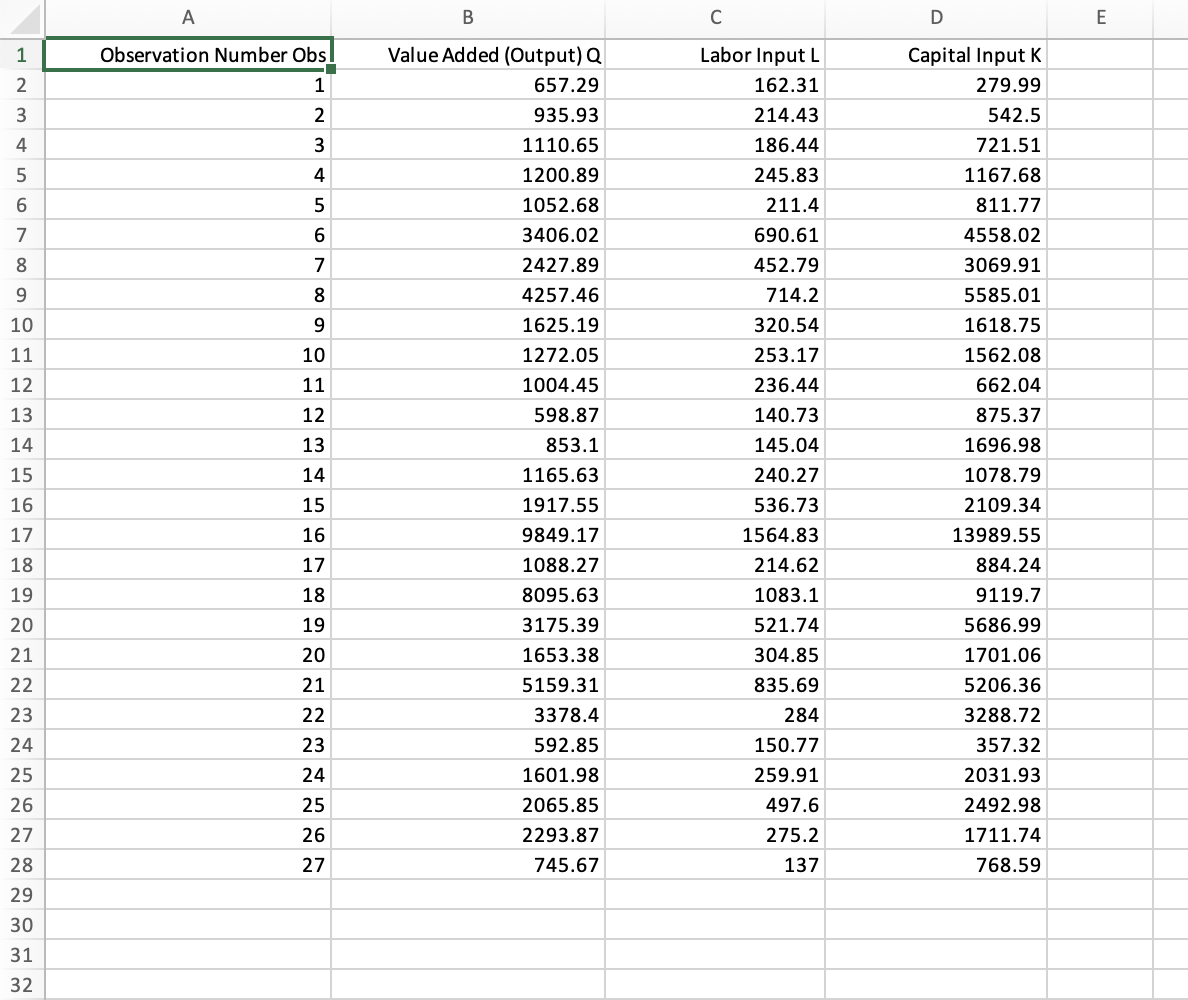
A D E 1 Observation Number Obs 2 1 3 2 4 3 5 OWN 4 6 5 7 6 8 7 9 10 11 10 12 13 11 12 8 9ou28Hs 14 13 Value Added (Output) Q 657.29 935.93 1110.65 1200.89 1052.68 3406.02 2427.89 4257.46 1625.19 1272.05 1004.45 598.87 853.1 1165.63 1917.55 9849.17 1088.27 8095.63 3175.39 1653.38 5159.31 3378.4 592.85 1601.98 2065.85 2293.87 745.67 Labor Input L 162.31 214.43 186.44 245.83 211.4 690.61 452.79 714.2 320.54 253.17 236.44 140.73 145.04 240.27 536.73 1564.83 214.62 1083.1 521.74 304.85 835.69 284 150.77 259.91 497.6 275.2 137 Capital Input K 279.99 542.5 721.51 1167.68 811.77 4558.02 3069.91 5585.01 1618.75 1562.08 662.04 875.37 1696.98 1078.79 2109.34 13989.55 884.24 9119.7 5686.99 1701.06 5206.36 3288.72 357.32 2031.93 2492.98 1711.74 768.59 15 14 16 15 17 16 17 18 19 18 20 19 21 20 22 23 24 21 22 23 25 24 25 26 27 26 28 27 29 30 31 32 2. Use the Production data spreadsheet in Excel Project 1 - LP Production Cost.xlsx for this question. This data measures output, capital inputs and labor inputs for 27 primary metal manufacturing establishments in the United States. a. In this file, in columns F, G, and H, calculate the natural log value of each of the 27 observations using the Excel function In. A D E 1 Observation Number Obs 2 1 3 2 4 3 5 OWN 4 6 5 7 6 8 7 9 10 11 10 12 13 11 12 8 9ou28Hs 14 13 Value Added (Output) Q 657.29 935.93 1110.65 1200.89 1052.68 3406.02 2427.89 4257.46 1625.19 1272.05 1004.45 598.87 853.1 1165.63 1917.55 9849.17 1088.27 8095.63 3175.39 1653.38 5159.31 3378.4 592.85 1601.98 2065.85 2293.87 745.67 Labor Input L 162.31 214.43 186.44 245.83 211.4 690.61 452.79 714.2 320.54 253.17 236.44 140.73 145.04 240.27 536.73 1564.83 214.62 1083.1 521.74 304.85 835.69 284 150.77 259.91 497.6 275.2 137 Capital Input K 279.99 542.5 721.51 1167.68 811.77 4558.02 3069.91 5585.01 1618.75 1562.08 662.04 875.37 1696.98 1078.79 2109.34 13989.55 884.24 9119.7 5686.99 1701.06 5206.36 3288.72 357.32 2031.93 2492.98 1711.74 768.59 15 14 16 15 17 16 17 18 19 18 20 19 21 20 22 23 24 21 22 23 25 24 25 26 27 26 28 27 29 30 31 32 2. Use the Production data spreadsheet in Excel Project 1 - LP Production Cost.xlsx for this question. This data measures output, capital inputs and labor inputs for 27 primary metal manufacturing establishments in the United States. a. In this file, in columns F, G, and H, calculate the natural log value of each of the 27 observations using the Excel function In
Step by Step Solution
There are 3 Steps involved in it

Get step-by-step solutions from verified subject matter experts