

Question: A data set comparing a woman's shoe size to her height is represented by the table. Shoe Size Height (inches) 7.5 63 8 70.5
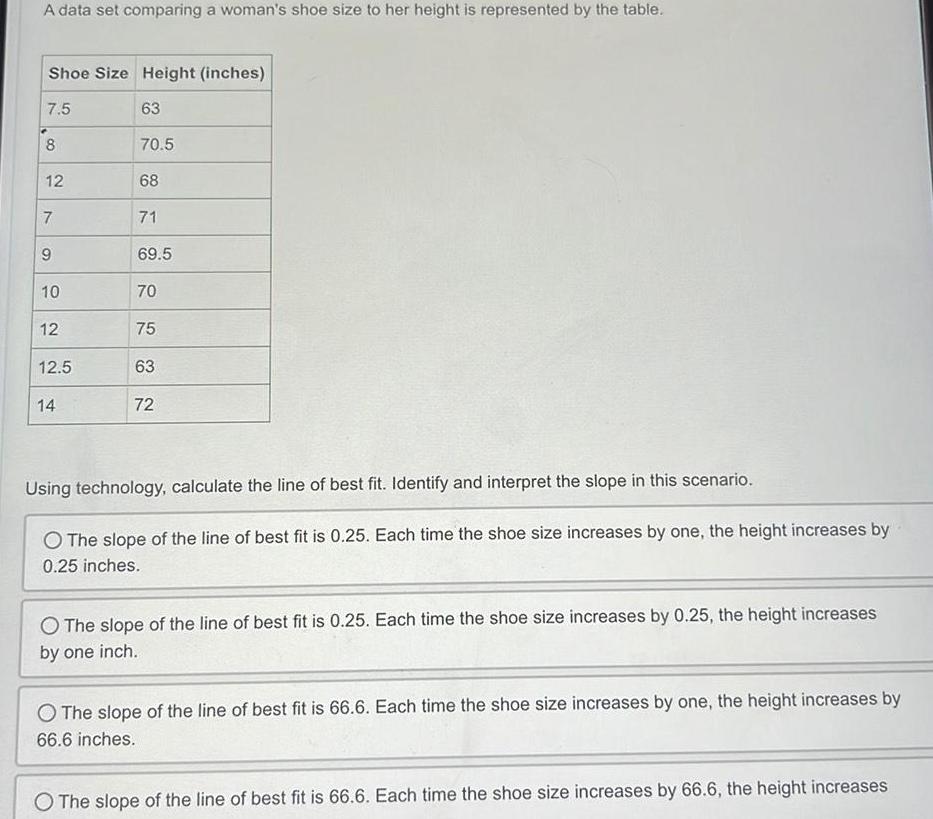
A data set comparing a woman's shoe size to her height is represented by the table. Shoe Size Height (inches) 7.5 63 8 70.5 12 68 7 71 9 69.5 10 70 12 75 12.5 63 14 72 Using technology, calculate the line of best fit. Identify and interpret the slope in this scenario. O The slope of the line of best fit is 0.25. Each time the shoe size increases by one, the height increases by 0.25 inches. The slope of the line of best fit is 0.25. Each time the shoe size increases by 0.25, the height increases by one inch. The slope of the line of best fit is 66.6. Each time the shoe size increases by one, the height increases by 66.6 inches. O The slope of the line of best fit is 66.6. Each time the shoe size increases by 66.6, the height increases
Step by Step Solution
There are 3 Steps involved in it

Get step-by-step solutions from verified subject matter experts