

Question: A data set is given below. (a) Draw a scatter diagram Comment on the type of relation that appears to exist between x and
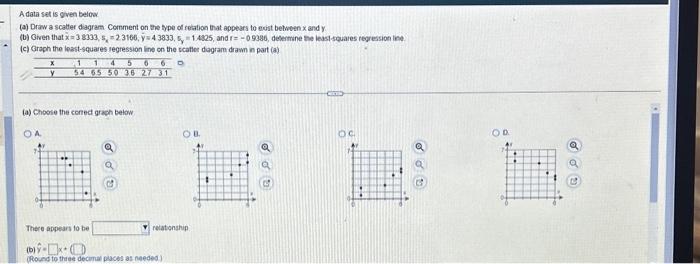
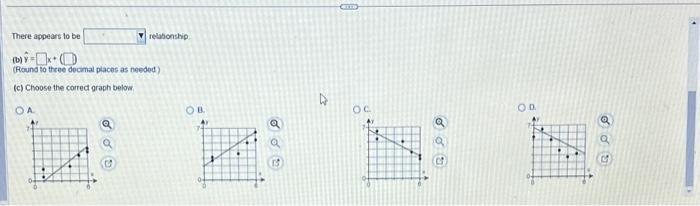
A data set is given below. (a) Draw a scatter diagram Comment on the type of relation that appears to exist between x and y (b) Given that x 38333, s, 2.3166, y 4 3833, 5, 1.4825, and r=-09386, determine the least-squares regression line (c) Graph the least-squares regression line on the scatter diagram drawn in part (a) 1145 660 x 54 65 50 36 27 31 (a) Choose the correct graph below. OA There appears to be OB OC OP relationship (Round to three decimal places as needed) There appears to be (b)-0 relationship (Round to three decimal places as needed) (c) Choose the correct graph below. OA OB. OD 200
Step by Step Solution
There are 3 Steps involved in it

Get step-by-step solutions from verified subject matter experts