

Question: A Data Table Requirement 1. Prepare a scatter plot of Rose Red's volume (miles driven) and van operating costs. Plot the points on the graph
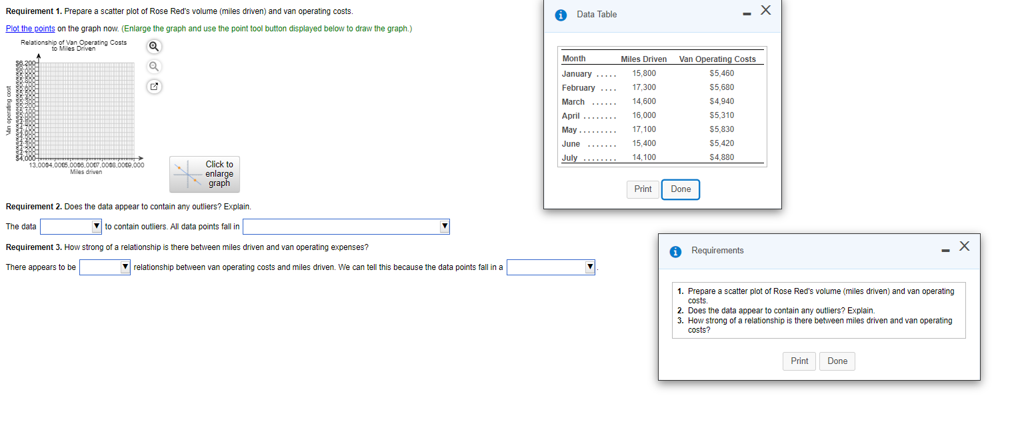
A Data Table Requirement 1. Prepare a scatter plot of Rose Red's volume (miles driven) and van operating costs. Plot the points on the graph now. (Enlarge the graph and use the point tool button displayed below to draw the graph.) Relationship of Van Operating costs Q Month January February March April May...... Miles Driven Van Operating costs 15,800 $5.450 17.300 $5.680 14,600 $4.940 16.000 $5,310 17.100 $5,830 15.400 $5.420 14,100 $4.880 June July 13.0004 000.000.000.000.000.000 Miles driven Click to enlarge graph Print Done Requirement 2. Does the data appear to contain any Outliers? Explain The data to contain outliers. All data points fall in . Requirement 3. How strong of a relationship is there between miles driven and van operating expenses? a There appears to be relationship between van operating costs and miles driven. We can tell this because the data points fall in a Requirements 1. Prepare a scatter plot of Rose Red's volume (miles driven) and van operating costs 2. Does the data appear to contain any outliers? Explain 3. How strong of a relationship is there between miles driven and van operating costs? Print Done A Data Table Requirement 1. Prepare a scatter plot of Rose Red's volume (miles driven) and van operating costs. Plot the points on the graph now. (Enlarge the graph and use the point tool button displayed below to draw the graph.) Relationship of Van Operating costs Q Month January February March April May...... Miles Driven Van Operating costs 15,800 $5.450 17.300 $5.680 14,600 $4.940 16.000 $5,310 17.100 $5,830 15.400 $5.420 14,100 $4.880 June July 13.0004 000.000.000.000.000.000 Miles driven Click to enlarge graph Print Done Requirement 2. Does the data appear to contain any Outliers? Explain The data to contain outliers. All data points fall in . Requirement 3. How strong of a relationship is there between miles driven and van operating expenses? a There appears to be relationship between van operating costs and miles driven. We can tell this because the data points fall in a Requirements 1. Prepare a scatter plot of Rose Red's volume (miles driven) and van operating costs 2. Does the data appear to contain any outliers? Explain 3. How strong of a relationship is there between miles driven and van operating costs? Print Done
Step by Step Solution
There are 3 Steps involved in it

Get step-by-step solutions from verified subject matter experts