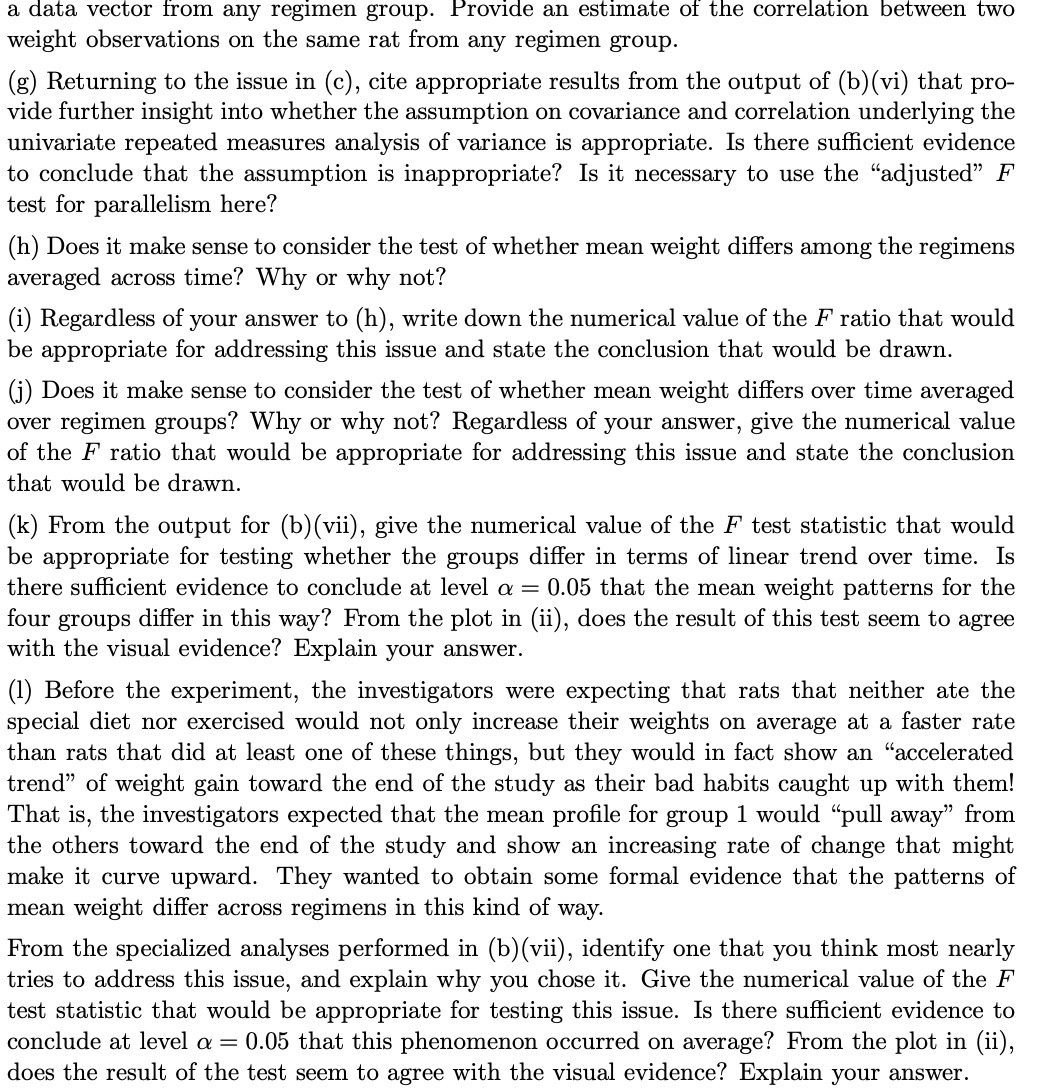
Question: a data vector from any regimen group. Provide an estimate of the correlation between two weight observations on the same rat from any regimen group.

a data vector from any regimen group. Provide an
a data vector from any regimen group. Provide an estimate of the correlation between two weight observations on the same rat from any regimen group. (g) Returning to the issue in (c), cite appropriate results from the output of (b)(vi) that pro- vide further insight into whether the assumption on covariance and correlation underlying the univariate repeated measures analysis of variance is appropriate. Is there sufficient evidence to conclude that the assumption is inappropriate? Is it necessary to use the \"adjusted\" F test for parallelism here? (h) Does it make sense to consider the test of whether mean weight differs among the regimens averaged across time? Why or why not? (i) Regardless of your answer to (h), write down the numerical value of the F ratio that would be appropriate for addressing this issue and state the conclusion that would be drawn. 0) Does it make sense to consider the test of whether mean weight differs over time averaged over regimen groups? Why or why not? Regardless of your answer, give the numerical value of the F ratio that would be appropriate for addressing this issue and state the conclusion that would be drawn. (k) From the output for (b)(vii), give the numerical value of the F test statistic that would be appropriate for testing whether the groups differ in terms of linear trend over time. Is there sufficient evidence to conclude at level a = 0.05 that the mean weight patterns for the four groups differ in this way? From the plot in (ii), does the result of this test seem to agree with the visual evidence? Explain your answer. (1) Before the experiment, the investigators were expecting that rats that neither ate the special diet nor exercised would not only increase their weights on average at a faster rate than rats that did at least one of these things, but they would in fact show an \"accelerated trend\" of weight gain toward the end of the study as their bad habits caught up with them! That is, the investigators expected that the mean prole for group 1 would \"pull away\" from the others toward the end of the study and show an increasing rate of change that might make it curve upward. They wanted to obtain some formal evidence that the patterns of mean weight differ across regimens in this kind of way. From the specialized analyses performed in (b)(vii), identify one that you think most nearly tries to address this issue, and explain why you chose it. Give the numerical value of the F test statistic that would be appropriate for testing this issue. Is there sufficient evidence to conclude at level a = 0.05 that this phenomenon occurred on average? From the plot in (ii), does the result of the test seem to agree with the visual evidence? Explain your

Step by Step Solution

There are 3 Steps involved in it

1 Expert Approved Answer
Step: 1 Unlock blur-text-image
Question Has Been Solved by an Expert!

Get step-by-step solutions from verified subject matter experts

Step: 2 Unlock
Step: 3 Unlock

Students Have Also Explored These Related Mathematics Questions!