

Question: a. describe what you can conclude from this table (gender and day of week)b. describe what you can conclude from this table(gender of month) c.
a. describe what you can conclude from this table (gender and day of week)b. describe what you can conclude from this table(gender of month) c. Look at the overall totals for Gender and Day of Week. Which gender was more likely to be involved in a fatal car accident in the U.S 2011? What day of the week was most likely for a fatal accident to have occured?
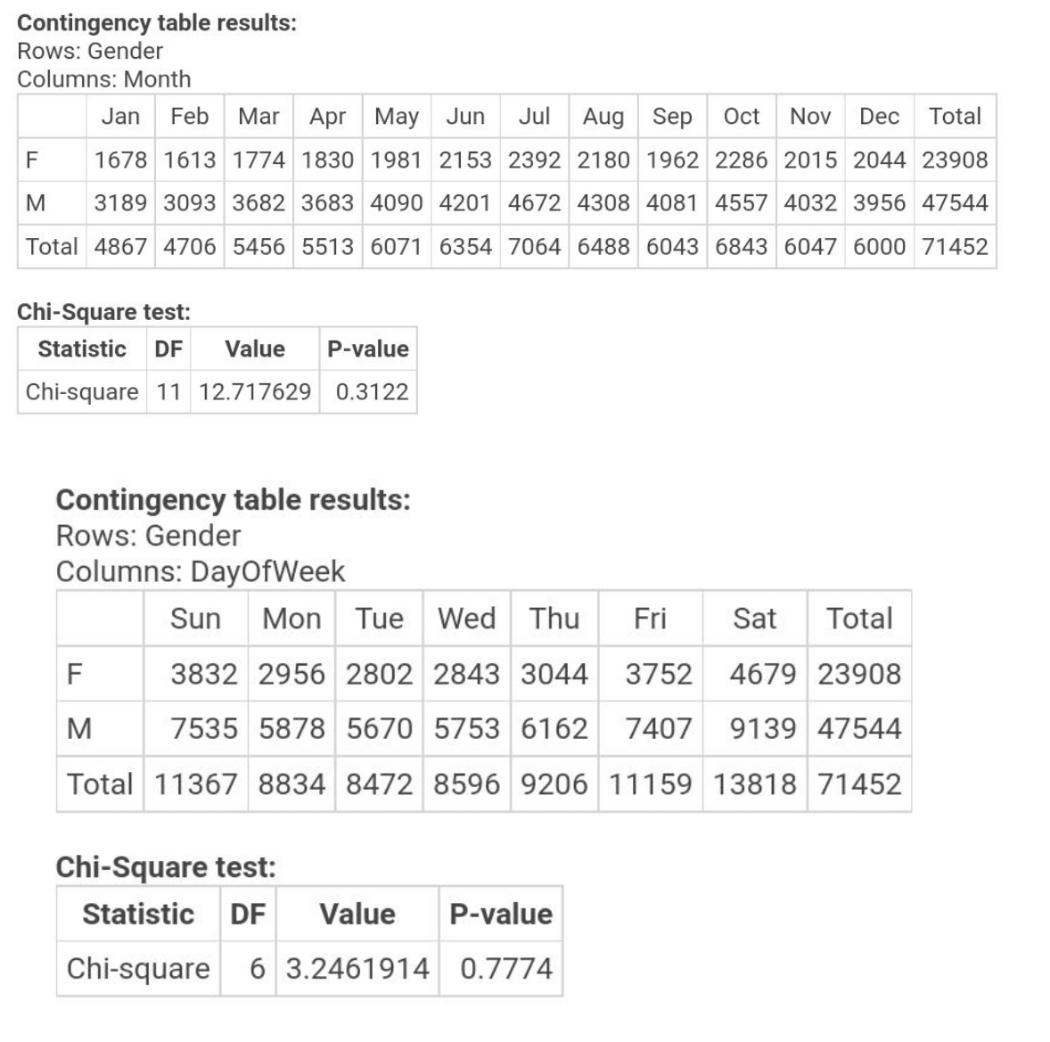
Contingency table results: Rows: Gender Columns: Month Jan Feb Mar Apr May Jun Jul Aug Sep Oct Nov Dec Total F 1678 1613 1774 1830 1981 2153 2392 2180 1962 2286 2015 2044 23908 M 3189 3093 3682 3683 4090 4201 4672 4308 4081 4557 4032 3956 47544 Total 4867 4706 5456 5513 6071 6354 7064 6488 6043 6843 6047 6000 71452 Chi-Square test: Statistic DF Value P-value Chi-square 11 12.717629 0.3122 Contingency table results: Rows: Gender Columns: DayOfWeek Sun Mon Tue Wed Thu Fri Sat Total F 3832 2956 2802 2843 3044 3752 4679 23908 M 7535 5878 5670 5753 6162 7407 9139 47544 Total 11367 8834 8472 8596 9206 11159 13818 71452 Chi-Square test: Statistic DF Value P-value Chi-square 6 3.2461914 0.7774
Step by Step Solution
There are 3 Steps involved in it

Get step-by-step solutions from verified subject matter experts