

Question: (a) Design a Matlab program that plots the two fuzzy membership functions as shown in Figure 1 8 marks 0.9 0.7 0.6 0.5 0.4 03
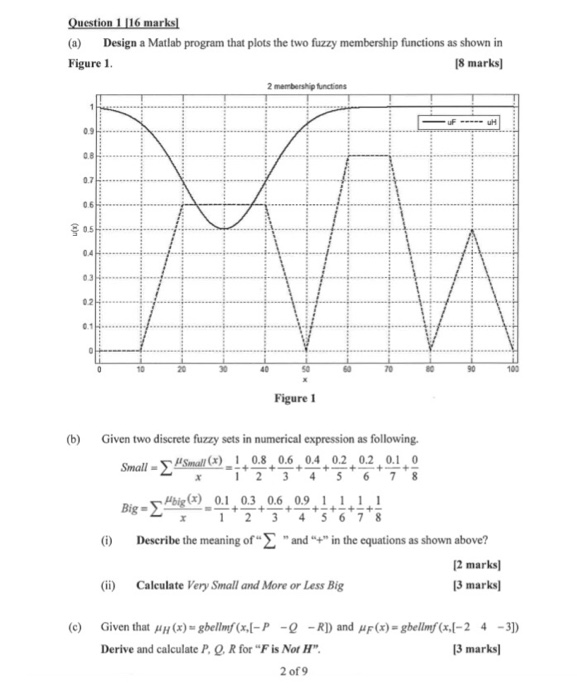
(a) Design a Matlab program that plots the two fuzzy membership functions as shown in Figure 1 8 marks 0.9 0.7 0.6 0.5 0.4 03 02 0.1 10 20 30 40 50 70 90 103 Figure I (b) Given two discrete fuzzy sets in numerical expression as following (x) 1 0.8 0.6 0.4 0.2 0.2 0.10 Small- che(x) Big 0.1 + 0.3 + 0.6 + 0.9 +-+-+-+- 0 Describe the meaning of"andin the equations as shown above? 2 marks 3 marks] ii) Calculate Very Small and More or Less Big (c) Given that (x)sgbellny'(x,[-P -Q -RI) and F(x)-gbellmy(xx-2 4-3) Derive and calculate P,Q. R for "F is Not H 3 marks 2 of9
Step by Step Solution
There are 3 Steps involved in it
1 Expert Approved Answer
Step: 1 Unlock

Question Has Been Solved by an Expert!
Get step-by-step solutions from verified subject matter experts
Step: 2 Unlock
Step: 3 Unlock