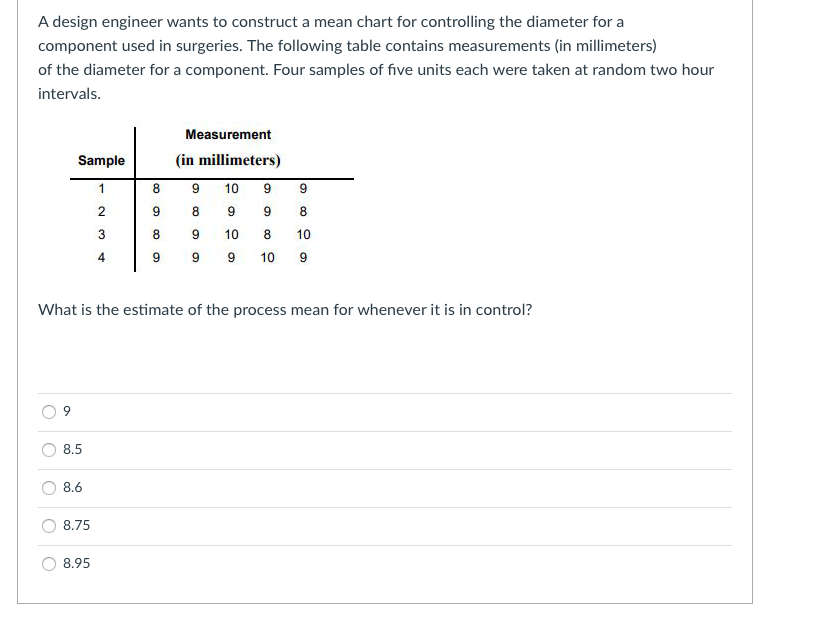
Question: A design engineer wants to construct a mean chart for controlling the diameter for a component used in surgeries. The following table contains measurements (in

A design engineer wants to construct a mean chartA design engineer wants to construct a mean chartA design engineer wants to construct a mean chart

A design engineer wants to construct a mean chart for controlling the diameter for a component used in surgeries. The following table contains measurements (in millimeters) of the diameter for a component. Four samples of five units each were taken at random two hour intervals. Measurement (in millimeters) Sample 1 8 9 10 9 9 9 2 9 8 8 3 8 9 8 10 10 9 4 9 9 10 9 What is the estimate of the process mean for whenever it is in control? O 9 O 8.5 8.6 8.75 8.95 What are the X-bar chart upper and lower control limits? 10.16 and 7.84 10.045 and 7.855 9.82 and 8.08 9.762 and 8.138 9.972 and 7.928 What is the estimate of the sample average range based upon this limited sample? 2. 1 1.5 1.4 0

Step by Step Solution

There are 3 Steps involved in it

1 Expert Approved Answer
Step: 1 Unlock blur-text-image
Question Has Been Solved by an Expert!

Get step-by-step solutions from verified subject matter experts

Step: 2 Unlock
Step: 3 Unlock

Students Have Also Explored These Related General Management Questions!