

Question: A design engineer wants to construct a sample mean chart for controlling the service life of one of the types of light bulbs his company
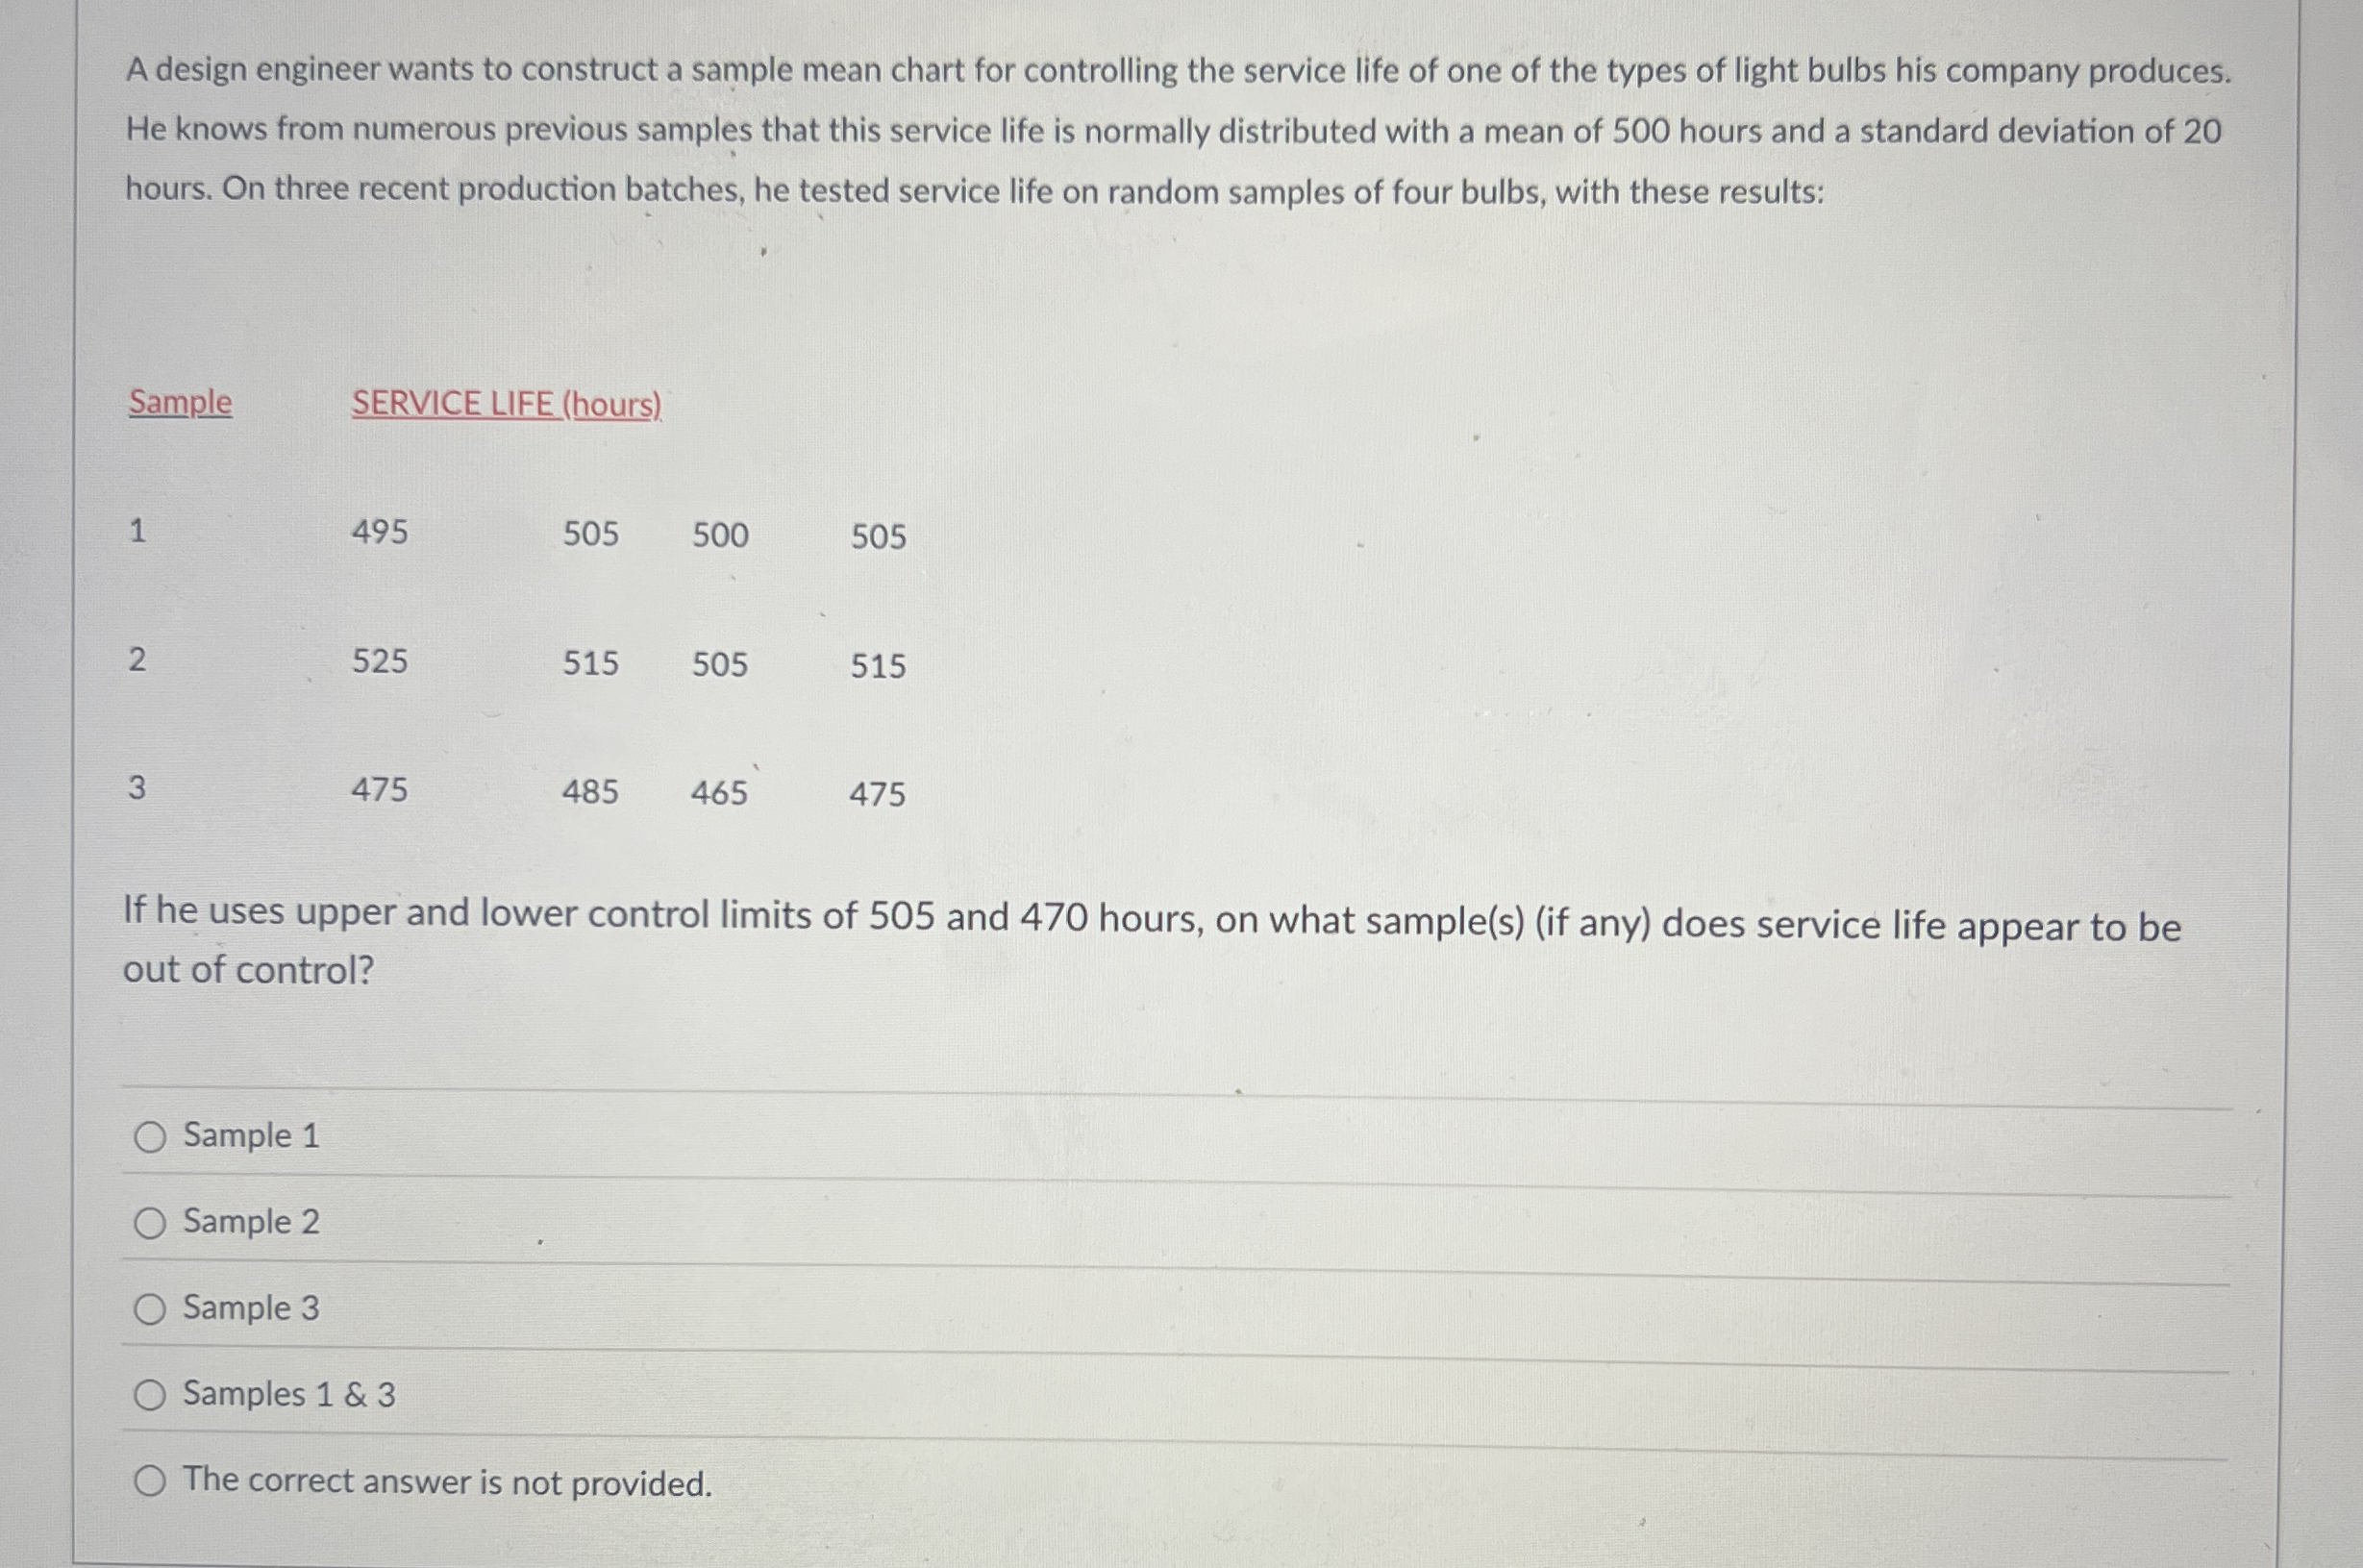
A design engineer wants to construct a sample mean chart for controlling the service life of one of the types of light bulbs his company produces.
He knows from numerous previous samples that this service life is normally distributed with a mean of hours and a standard deviation of
hours. On three recent production batches, he tested service life on random samples of four bulbs, with these results:
Sample SERVICE LIFE hours
If he uses upper and lower control limits of and hours, on what samplesif any does service life appear to be
out of control?
Sample
Sample
Sample
Samples &
The correct answer is not provided.
Step by Step Solution
There are 3 Steps involved in it
1 Expert Approved Answer
Step: 1 Unlock

Question Has Been Solved by an Expert!
Get step-by-step solutions from verified subject matter experts
Step: 2 Unlock
Step: 3 Unlock