

Question: A design engineer wants to construct a sample mean chart for controlling the service life of one of the types of light bulbs his company
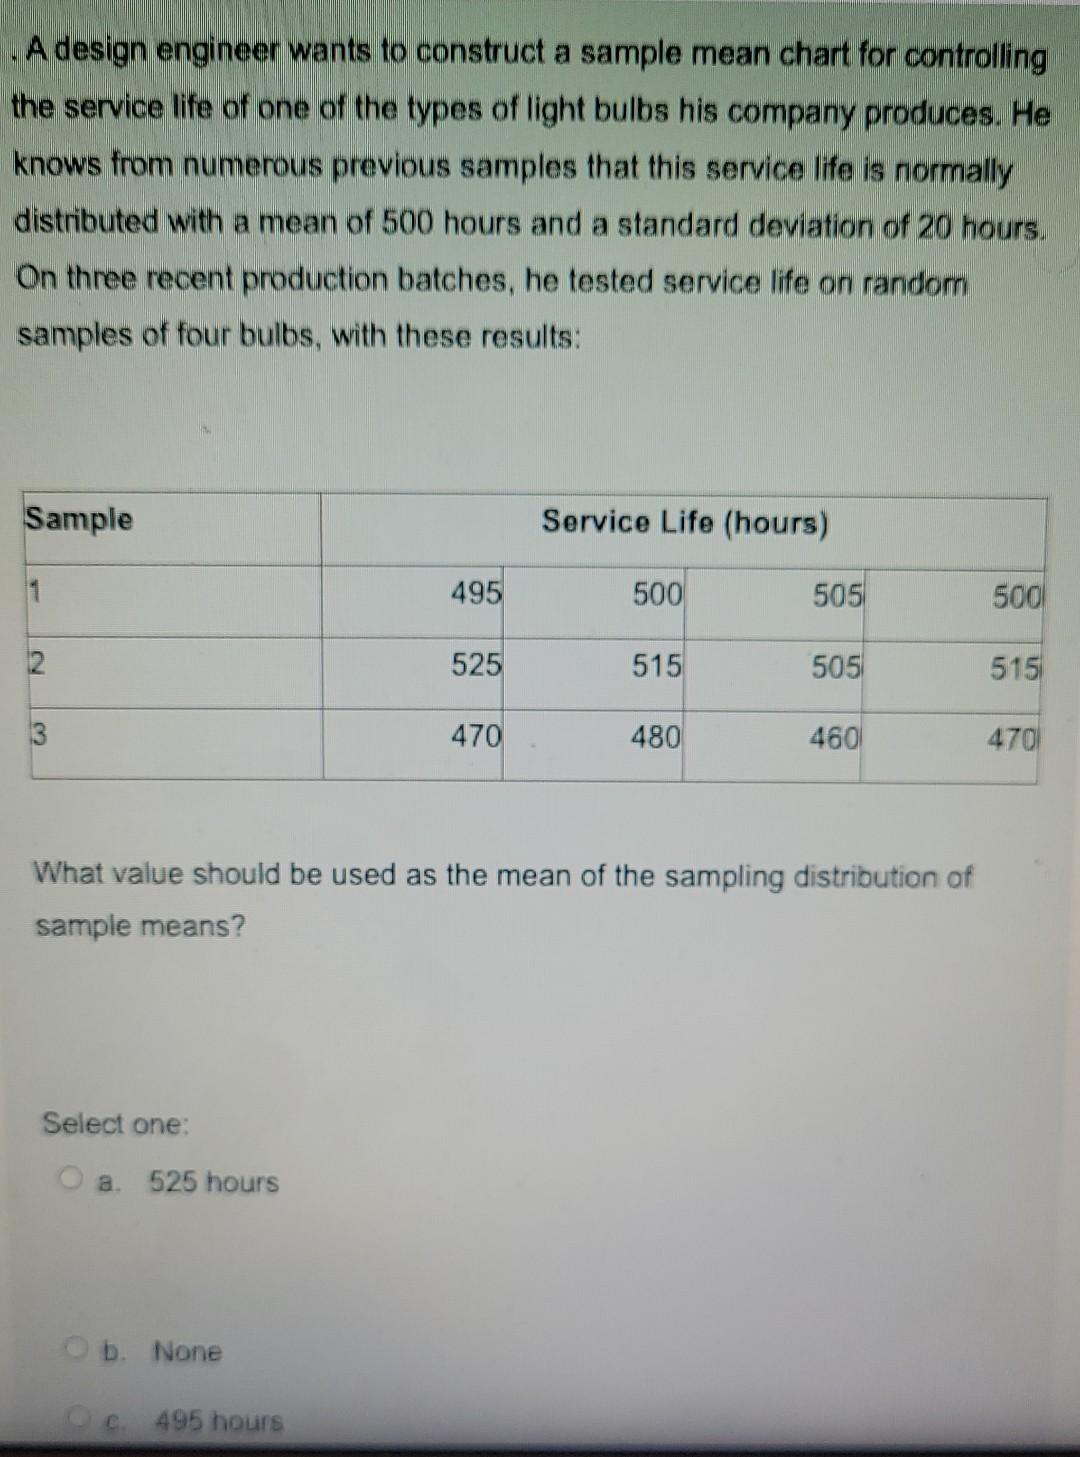
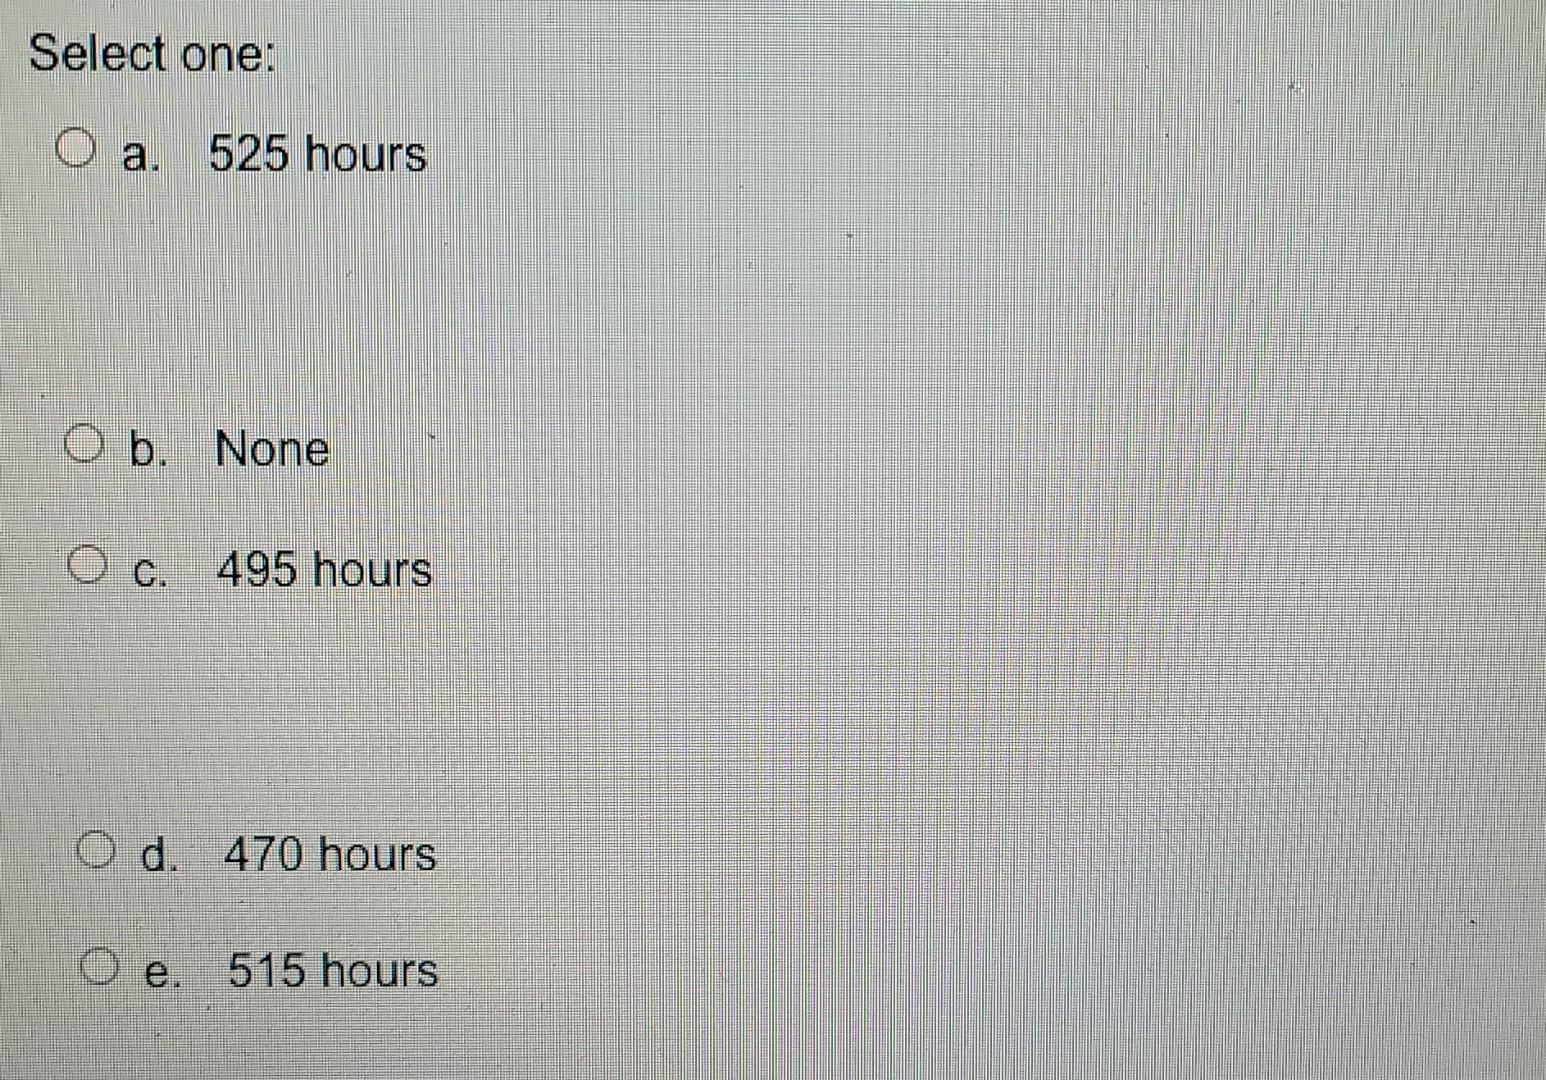
A design engineer wants to construct a sample mean chart for controlling the service life of one of the types of light bulbs his company produces. He knows from numerous previous samples that this service life is normally distributed with a mean of 500 hours and a standard deviation of 20 hours, On three recent production batches, he tested service life on random samples of four bulbs, with these results: Sample Service Life (hours) 1 495 500 505 500 2 525 515 505 515 3 470 480 460 470 What value should be used as the mean of the sampling distribution of sample means? Select one: a. 525 hours b. None 495 hours Select one: . 525 hours Ob. None O c. 495 hours d. 470 hours O e. 515 hours
Step by Step Solution
There are 3 Steps involved in it
1 Expert Approved Answer
Step: 1 Unlock

Question Has Been Solved by an Expert!
Get step-by-step solutions from verified subject matter experts
Step: 2 Unlock
Step: 3 Unlock