

Question: a) Determine the upper and lower control limits and the overall means for -charts and R-charts. b) Draw the charts and plot the values of
a) Determine the upper and lower control limits and the overall means for -charts and R-charts.
b) Draw the charts and plot the values of the sample means and ranges.
c) Do the data indicate a process that is in control?
d) Why or why not
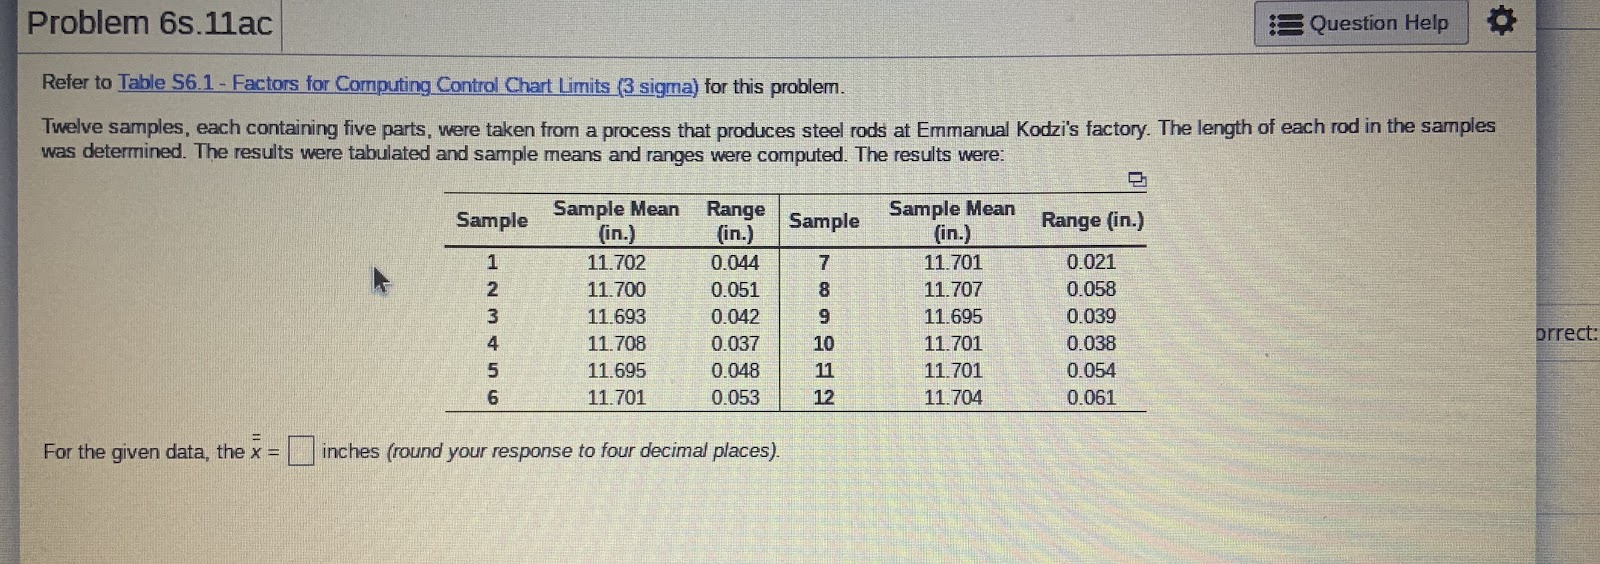
Problem 6s.11ac Question Help Refer to Table S6.1 - Factors for Computing Control Chart Limits (3 sigma) for this problem. Twelve samples, each containing five parts, were taken from a process that produces steel rods at Emmanual Kodzi's factory. The length of each rod in the samples was determined. The results were tabulated and sample means and ranges were computed. The results were: Sample Range (in.) on WNP Sample Mean Range (in.) (in.) 11.702 0.044 11.700 0.051 11.693 0.042 11.708 0.037 11.695 0.048 11.701 0.053 come Sample Mean (in.) 11.701 11.707 11.695 11.701 11.701 11.704 0.021 0.058 0.039 0.038 0.054 0.061 brrect: For the given data, th inches (round your response to four decimal places)Step by Step Solution
There are 3 Steps involved in it
1 Expert Approved Answer
Step: 1 Unlock

Question Has Been Solved by an Expert!
Get step-by-step solutions from verified subject matter experts
Step: 2 Unlock
Step: 3 Unlock