

Question: a ) Determine the upper and lower control limits of the x - chart, where = 3 . Use the following equations to set the
a Determine the upper and lower control limits of the chart, where
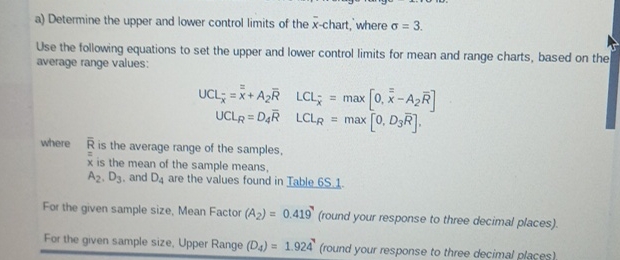
Use the following equations to set the upper and lower control limits for mean and range charts, based on the average range values:
max
max
where is the average range of the samples,
is the mean of the sample means,
and are the values found in Table
For the given sample size, Mean Factor round your response to three decimal places
For the given sample size, Upper Range round your response to three decimal places
Step by Step Solution
There are 3 Steps involved in it
1 Expert Approved Answer
Step: 1 Unlock

Question Has Been Solved by an Expert!
Get step-by-step solutions from verified subject matter experts
Step: 2 Unlock
Step: 3 Unlock