

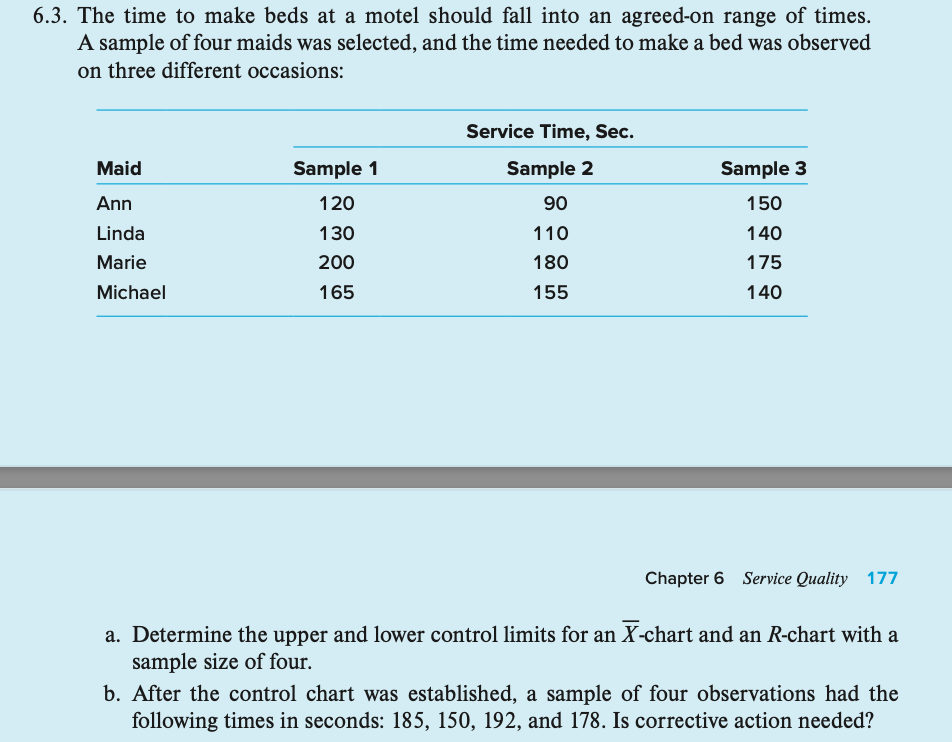
Question: a . Determine the upper the lower control limits for an x bar chart and an r bar chart with a sample size of four.
a Determine the upper the lower control limits for an x bar chart and an r bar chart with a sample size of four.
b After the control chart was established, a sample of four observations had the following times in seconds, and Is corrective actions needed?
Step by Step Solution
There are 3 Steps involved in it
1 Expert Approved Answer
Step: 1 Unlock

Question Has Been Solved by an Expert!
Get step-by-step solutions from verified subject matter experts
Step: 2 Unlock
Step: 3 Unlock