

Question: ( a ) Develop a frequency distribution using classes of 1 2 - 1 4 , 1 5 - 1 7 , 1 8 -
a Develop a frequency distribution using classes of and
A frequency distribution is a tabular summary of data showing the number frequency of observations in each of several nonoverlapping categories or classes. There is also a final row
displaying the total sample size. To develop a frequency distribution for the given data, count the number of times each value appears in the given ranges. This can be done in Excel using the
FREQUENCY function. This function has the format FREQUENCY range of data, upper class limits
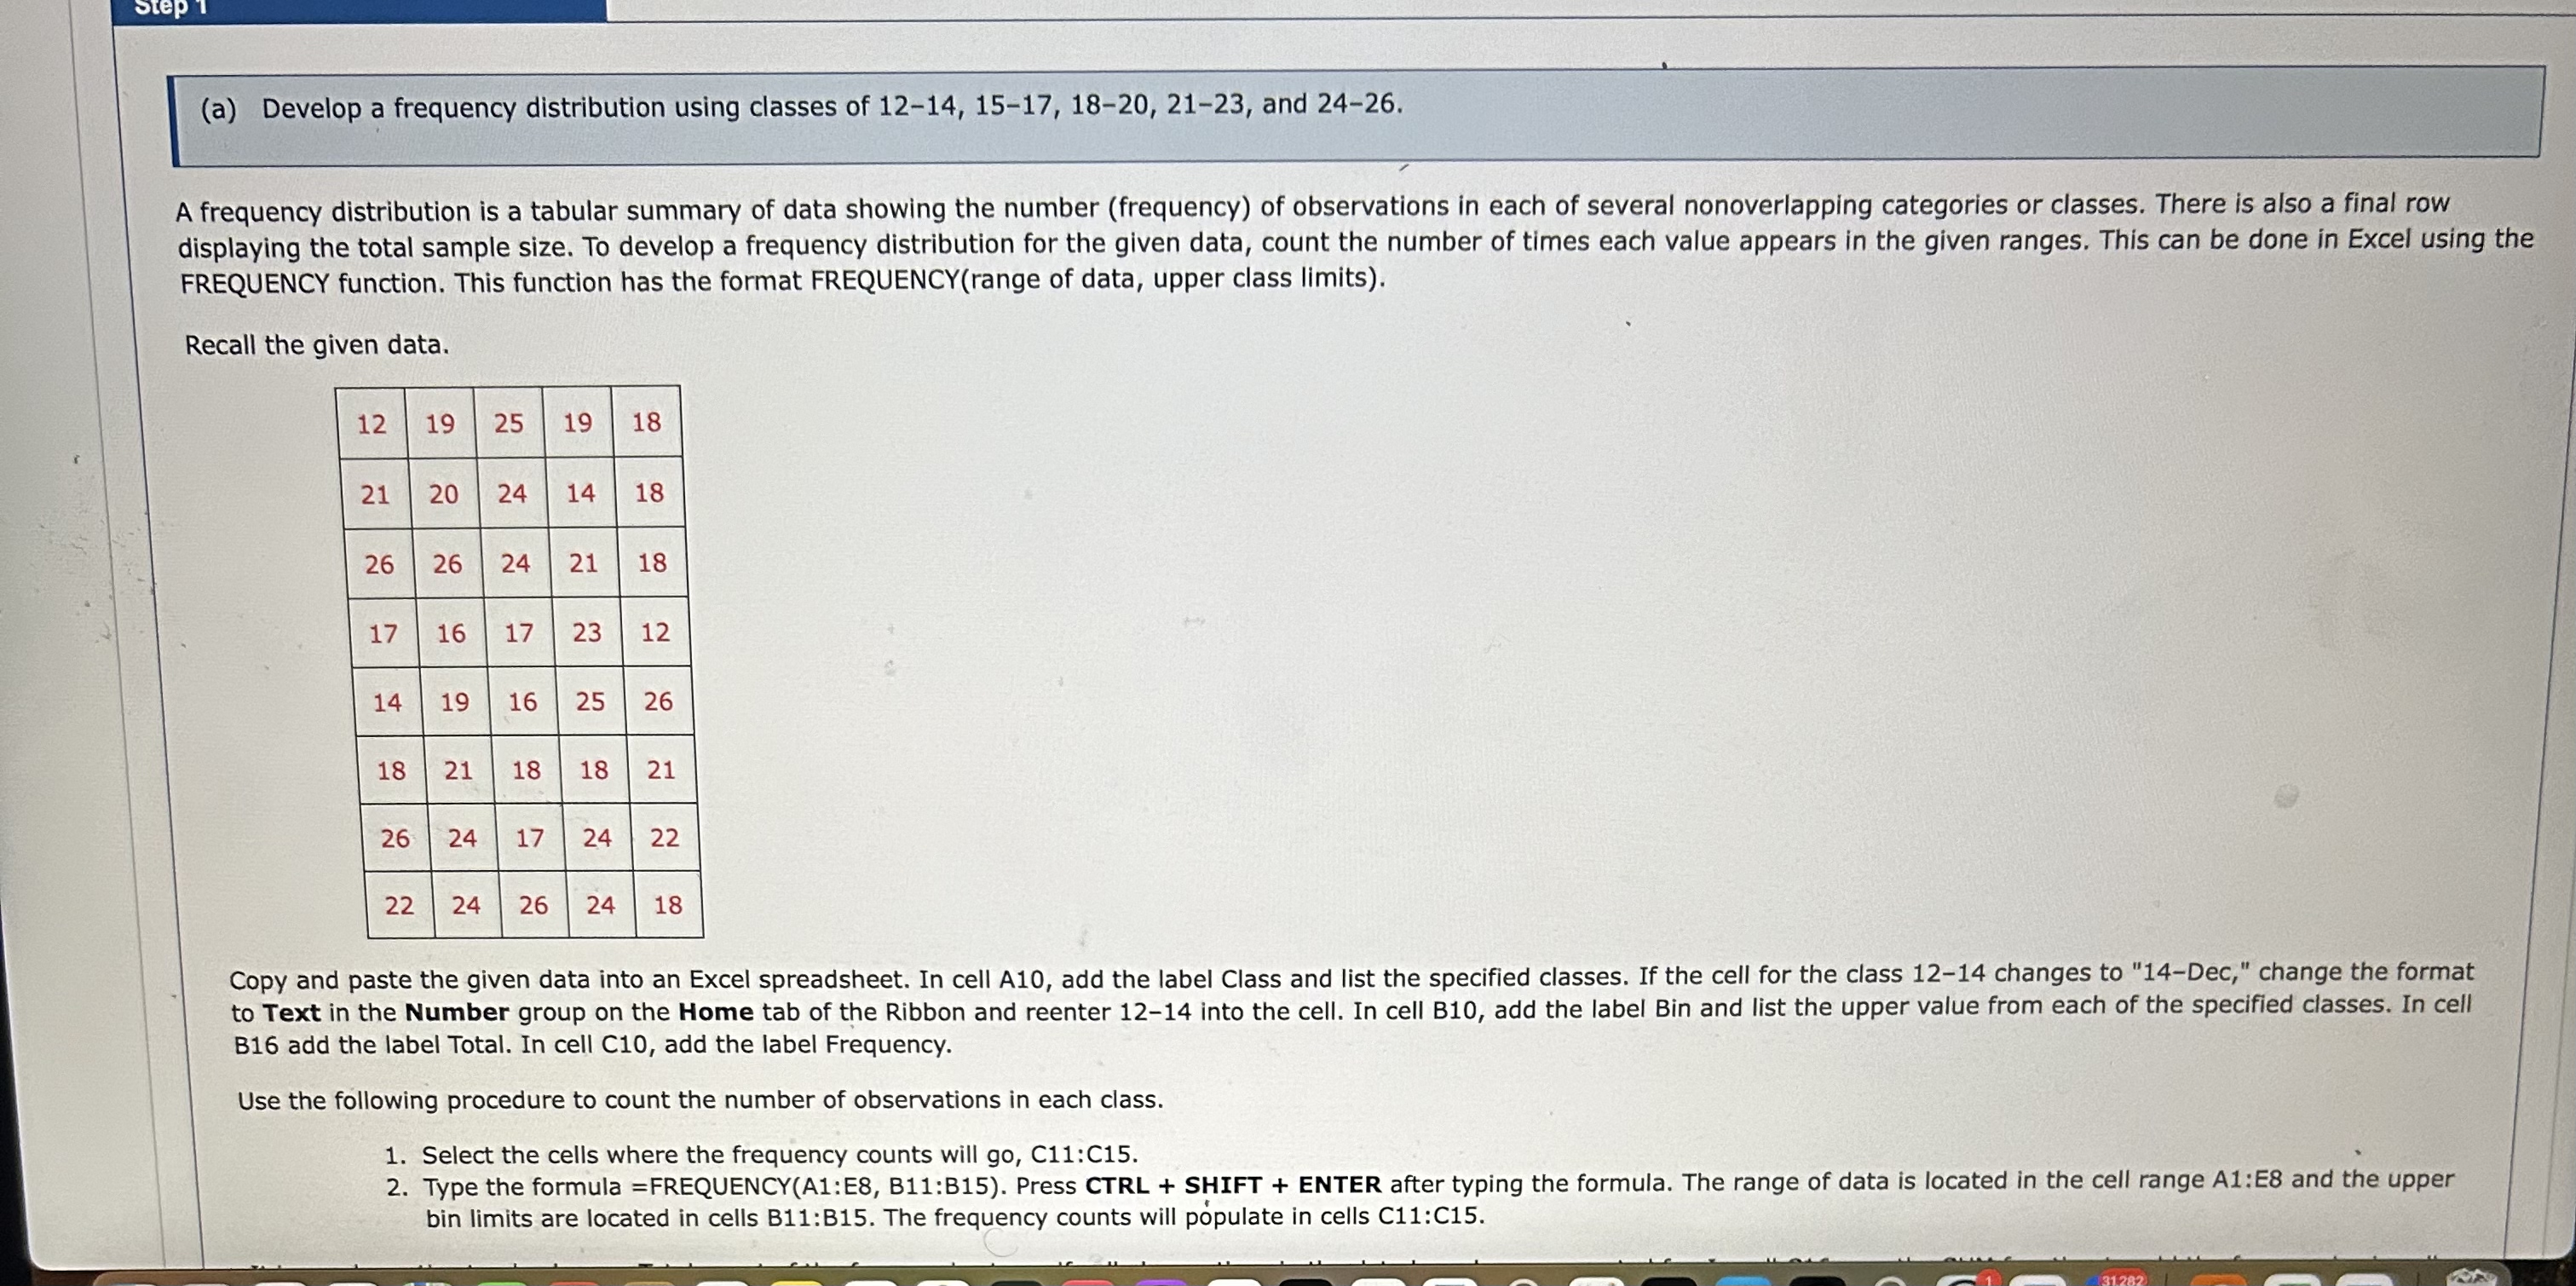
Recall the given data.
Copy and paste the given data into an Excel spreadsheet. In cell A add the label Class and list the specified classes. If the cell for the class changes to Dec," change the format
to Text in the Number group on the Home tab of the Ribbon and reenter into the cell. In cell B add the label Bin and list the upper value from each of the specified classes. In cell
B add the label Total. In cell C add the label Frequency.
Use the following procedure to count the number of observations in each class.
Select the cells where the frequency counts will go C:C
Type the formula FREQUENCYA:E B:B Press CTRL SHIFT ENTER after typing the formula. The range of data is located in the cell range A:E and the upper
bin limits are located in cells B:B The frequency counts will ppulate in cells C:C
Step by Step Solution
There are 3 Steps involved in it
1 Expert Approved Answer
Step: 1 Unlock

Question Has Been Solved by an Expert!
Get step-by-step solutions from verified subject matter experts
Step: 2 Unlock
Step: 3 Unlock