

Question: a . Develop a linear trend equation for the following data on demand for white bread loaves at a bakery ( use of Excel's Trendline,
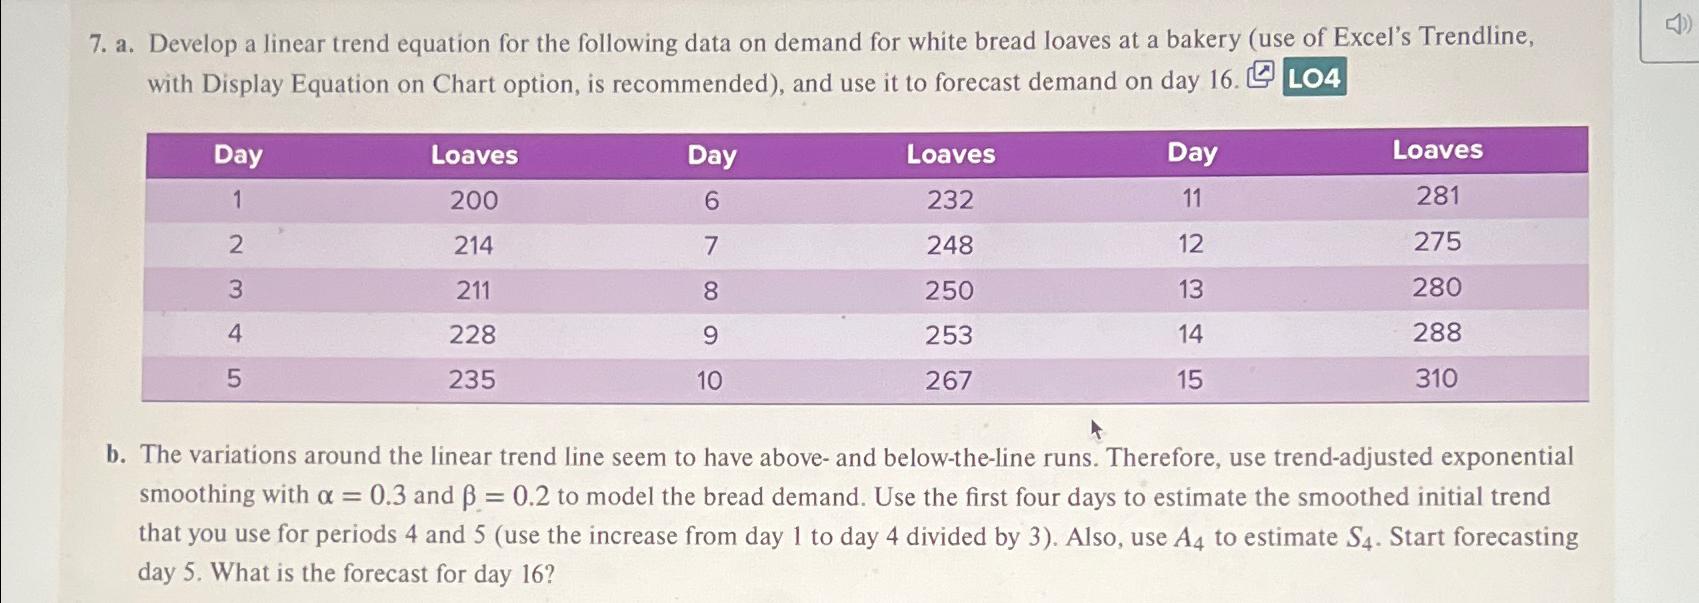
a Develop a linear trend equation for the following data on demand for white bread loaves at a bakery use of Excel's Trendline, with Display Equation on Chart option, is recommended and use it to forecast demand on day
tableDayLoaves,Day,Loaves,Day,Loaves
b The variations around the linear trend line seem to have above and belowtheline runs. Therefore, use trendadjusted exponential smoothing with and to model the bread demand. Use the first four days to estimate the smoothed initial trend that you use for periods and use the increase from day to day divided by Also, use to estimate Start forecasting day What is the forecast for day
Step by Step Solution
There are 3 Steps involved in it
1 Expert Approved Answer
Step: 1 Unlock

Question Has Been Solved by an Expert!
Get step-by-step solutions from verified subject matter experts
Step: 2 Unlock
Step: 3 Unlock