

Question: a. Do a bar chart: lunch, dinner, and delivery sales by day (interpret). B. Do line chart: lunch, dinner, and delivery sales by date of
a. Do a bar chart: lunch, dinner, and delivery sales by day (interpret).
B. Do line chart: lunch, dinner, and delivery sales by date of the month (interpret).
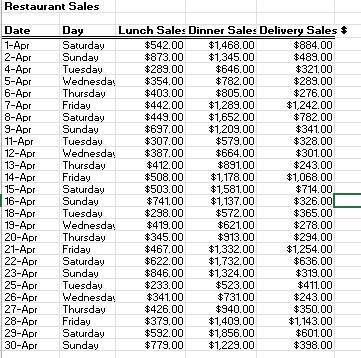
Restaurant Sales Date 1-Apr 2-Apr 4-Apr 5-Apr 6-Apr 7-Apr 8-Apr 9-Apr Day Saturday Sunday Tuesday Wednesday Thursday Friday Saturday Sunday Tuesday 11-Apr 12-Apr 13-Apr Thursday 14-Apr Friday 15-Apr Saturday 16-Apr Sunday 18-Apr Tuesday 21-Apr 22-Apr 23-Apr 25-Apr 26-Apr Wednesday 19-Apr Wednesda 20-Apr Thursday Friday Saturday Sunday Tuesday Wednesday 27-Apr Thursday 28-Apr Friday 29-Apr Saturday 30-Apr Sunday Lunch Sales Dinner Sales Delivery Sales $ $542.00 $873.00 $289.00 $354.00 $403.00 $442.00 $449.00 $697.00 $307.00 $387.00 $412.00 $508.00 $503.00 $741.00 $298.00 $419.00 $345.00 $467.00 $622.00 $846.00 $233.00 $341.00 $426.00 $1,468.00 $1,345.00 $646.00 $782.00 $805.00 $1,289.00 $1,652.00 $1,209.00 $579.00 $664.00 $891.00 $1,178.00 $1,581.00 $1,137.00 $572.00 $592.00 $779.00 $621.00 $913.00 $1,332.00 $1,732.00 $1,324.00 $523.00 $731.00 $940.00 $379.00 $1,409.00 $1,856.00 $1,229.00 $884.00 $489.00 $321.00 $289.00 $ 276.00 $1,242.00 $782.00 $341.00 $328.00 $301.00 $243.00 $1,068.00 $714.00 $326.00 $365.00 $278.00 $294.00 $1,254.00 $636.00 $319.00 $411.00 $243.00 $350.00 $1,143.00 $601.00 $398.00
Step by Step Solution
3.36 Rating (159 Votes )
There are 3 Steps involved in it
step 1 Line Chart for Sales of Lunch Dinner Del... View full answer

Get step-by-step solutions from verified subject matter experts