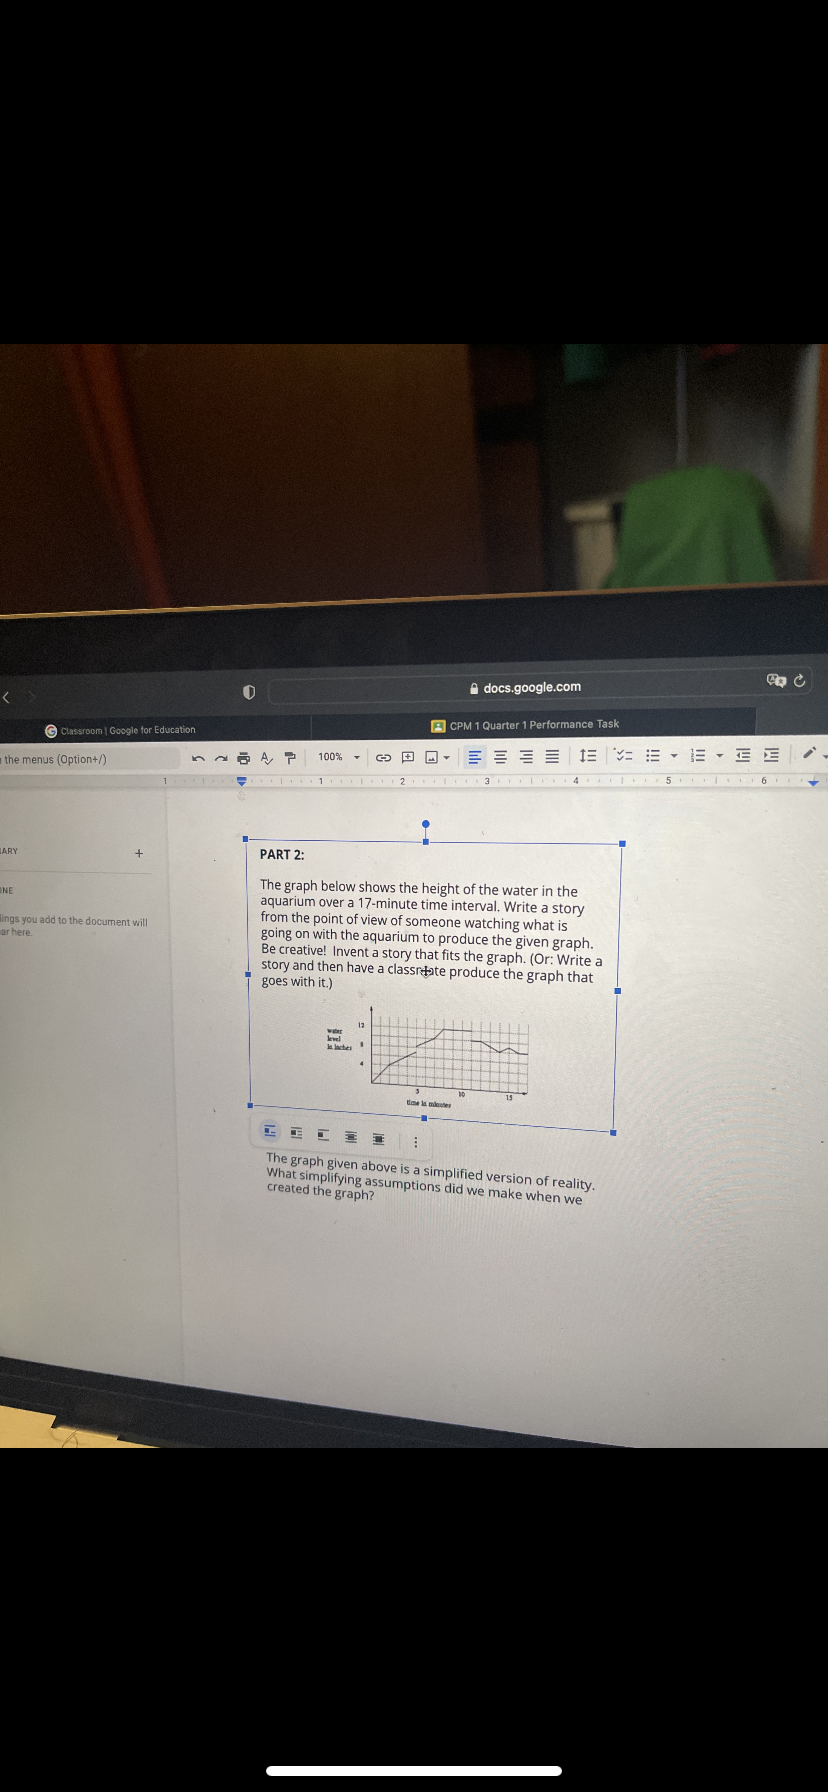
Question: A docs.google.com CPM 1 Quarter 1 Performance Task G Classroom | Google for Education the menus (Option+/) ARY + PART 2: The graph below shows

A docs.google.com CPM 1 Quarter 1 Performance
A docs.google.com CPM 1 Quarter 1 Performance Task G Classroom | Google for Education the menus (Option+/) ARY + PART 2: The graph below shows the height of the water in the aquarium over a 17-minute time interval. Write a story from the point of view of someone watching what is ings you add to the document will ar here going on with the aquarium to produce the given graph. Be creative! Invent a story that fits the graph. (Or: Write a story and then have a classrelate produce the graph that goes with it.) The graph given above is a simplified version of reality. What simplifying assumptions did we make when we created the graph

Step by Step Solution

There are 3 Steps involved in it

1 Expert Approved Answer
Step: 1 Unlock blur-text-image
Question Has Been Solved by an Expert!

Get step-by-step solutions from verified subject matter experts

Step: 2 Unlock
Step: 3 Unlock

Students Have Also Explored These Related Mathematics Questions!