

Question: a) does the scatter plot of the data support the use of simple linear regression model? The bond behavior of reinforcing bars is an

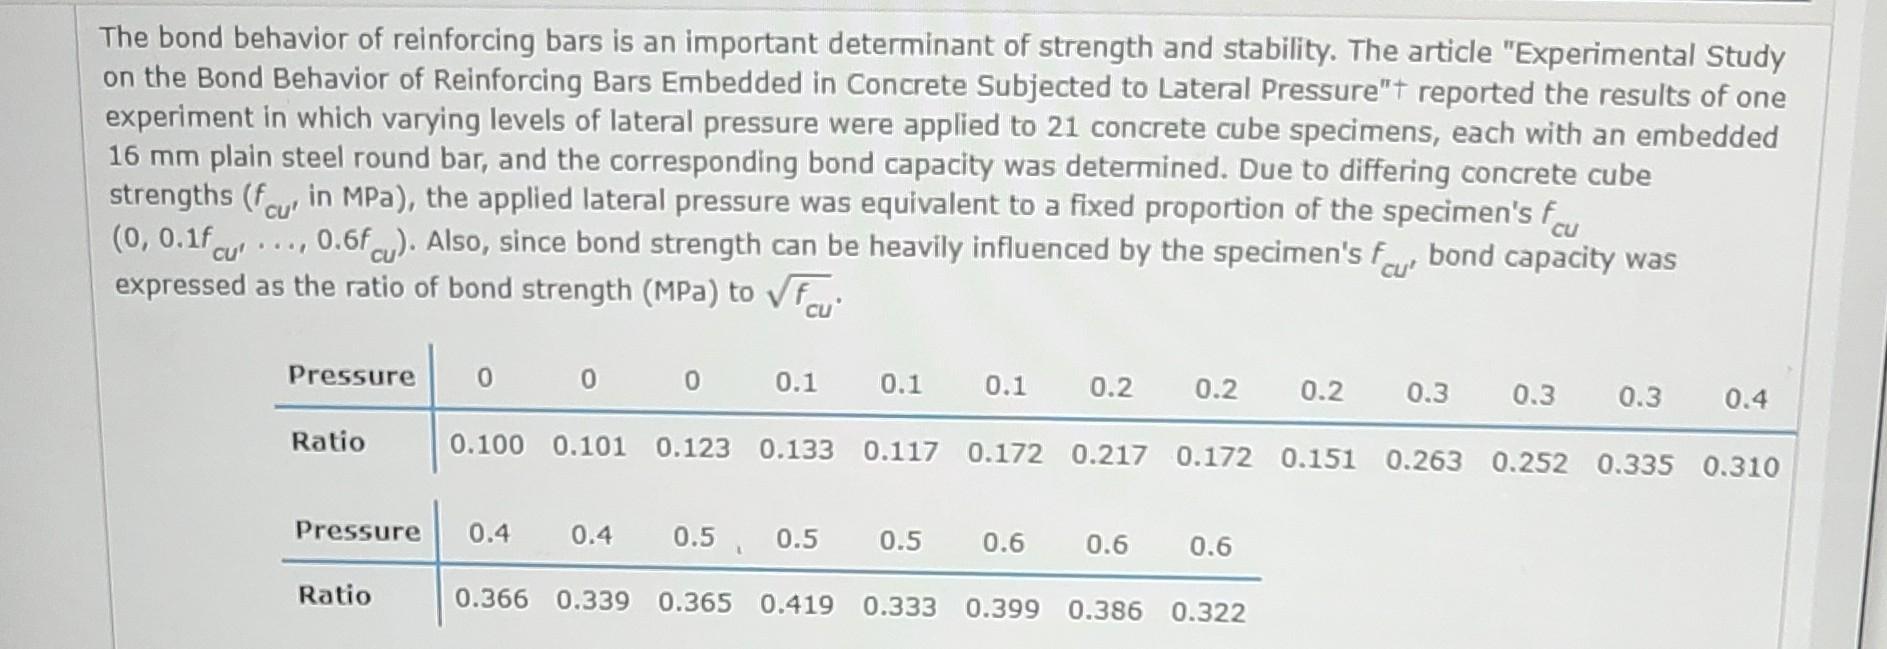
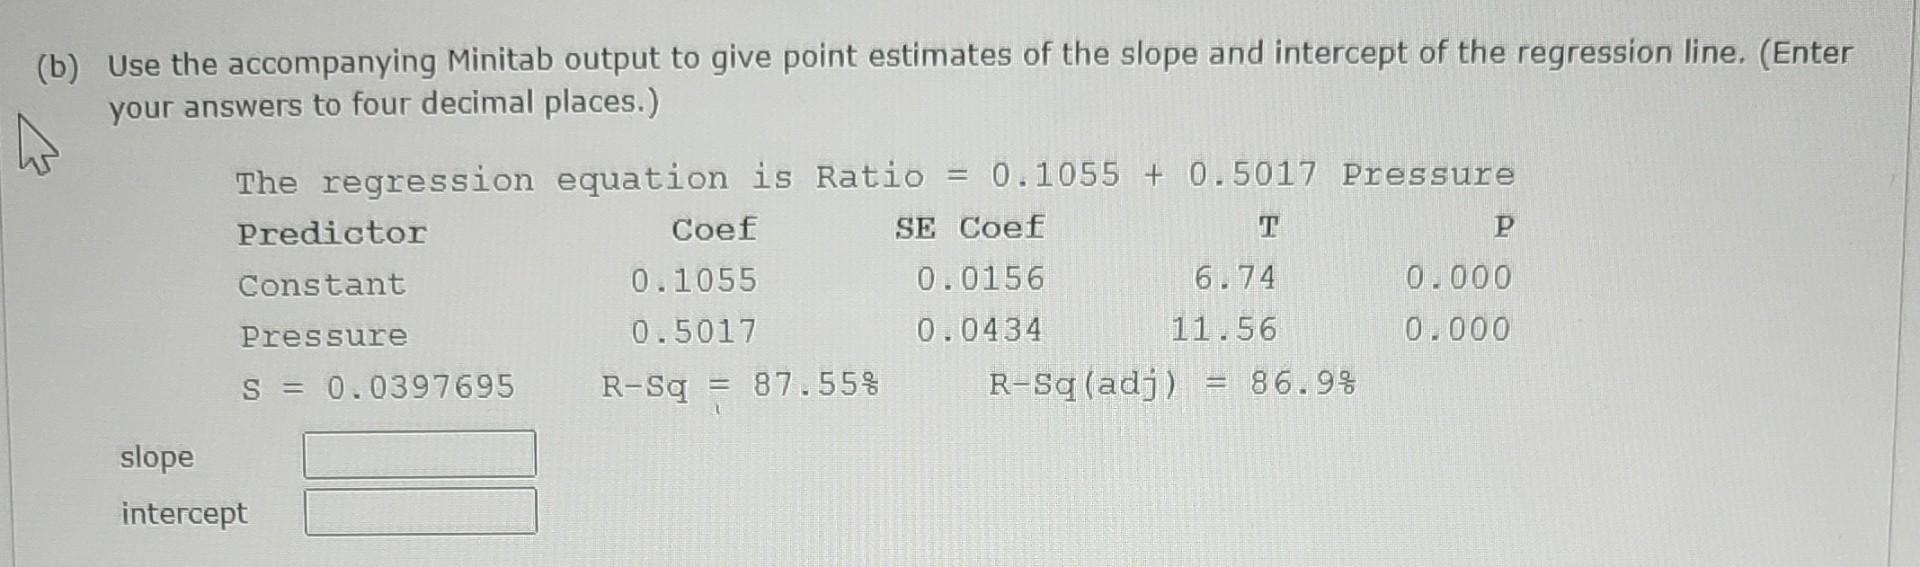
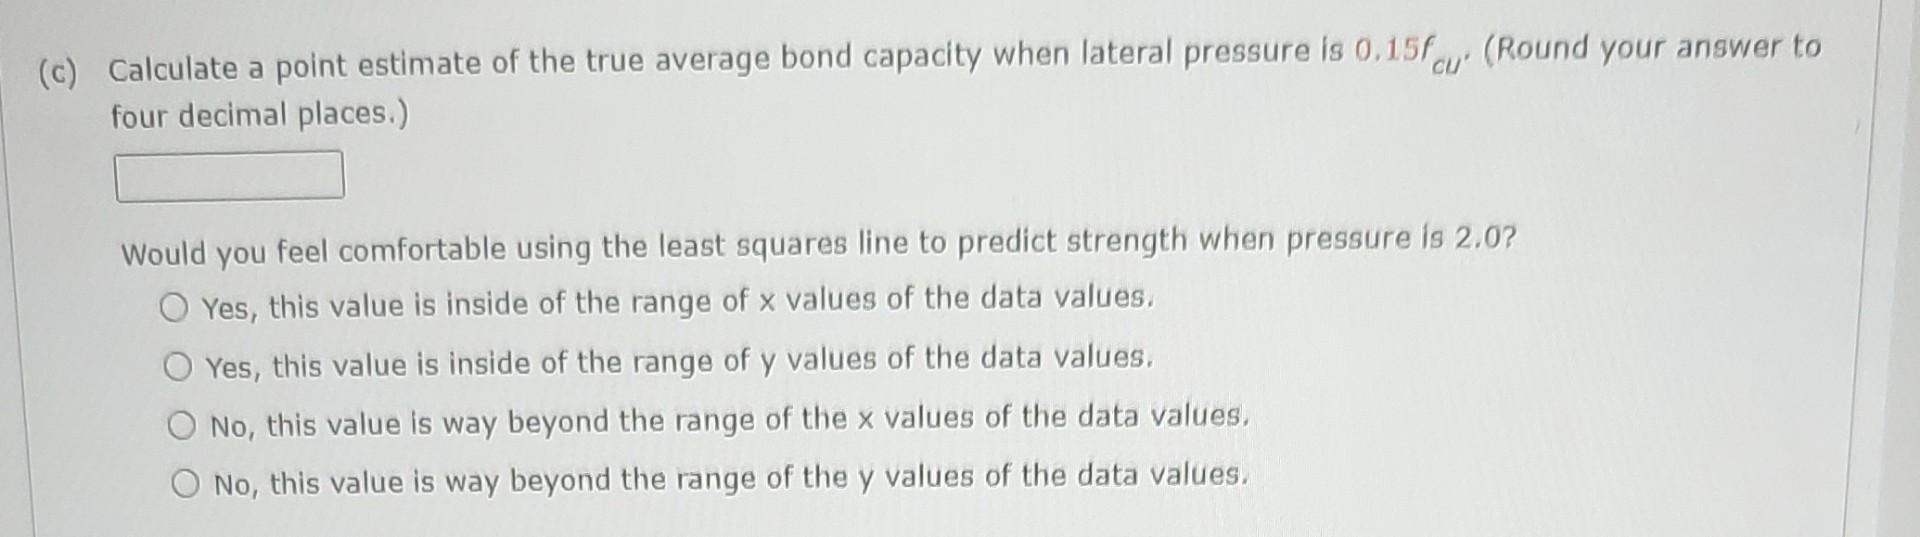
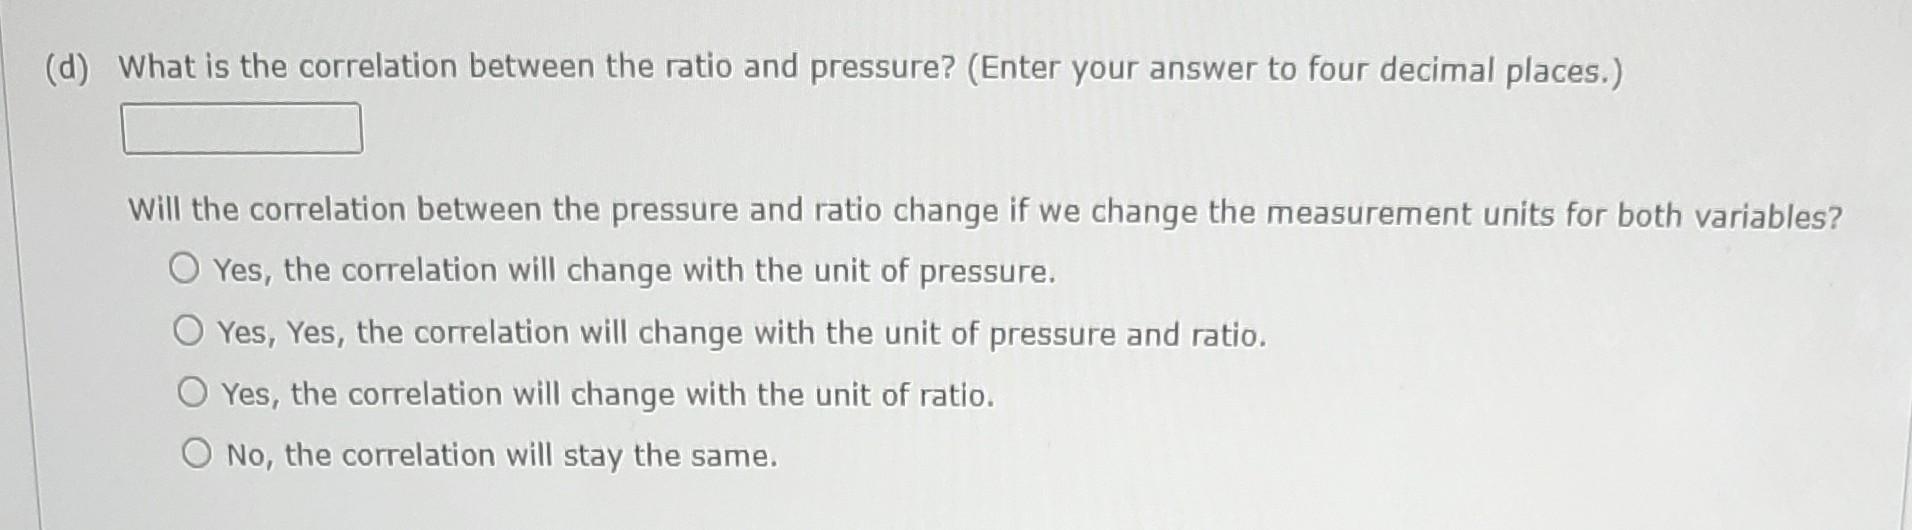
a) does the scatter plot of the data support the use of simple linear regression model? The bond behavior of reinforcing bars is an important determinant of strength and stability. The article "Experimental Study on the Bond Behavior of Reinforcing Bars Embedded in Concrete Subjected to Lateral Pressure"+ reported the results of one experiment in which varying levels of lateral pressure were applied to 21 concrete cube specimens, each with an embedded 16 mm plain steel round bar, and the corresponding bond capacity was determined. Due to differing concrete cube strengths (feu in MPa), the applied lateral pressure was equivalent to a fixed proportion of the specimen's fcu (0, 0.1fcu'. ..., 0.6f). Also, since bond strength can be heavily influenced by the specimen's fur bond capacity was expressed as the ratio of bond strength (MPa) to cu Pressure Ratio 0 0.100 0.101 0.123 Ratio 0 0 0.1 0.133 0.1 0.117 0.1 0.2 0.2 0.2 0.3 0.3 0.3 0.4 0.172 0.217 0.172 0.151 0.263 0.252 0.335 0.310 Pressure 0.4 0.4 0.5 0.5 0.5 0.6 0.6 0.6 0.366 0.339 0.365 0.419 0.333 0.399 0.386 0.322 (b) Use the accompanying Minitab output to give point estimates of the slope and intercept of the regression line. (Enter your answers to four decimal places.) The regression equation is Ratio = 0.1055 +0.5017 Pressure SE Coef T 0.0156 6.74 0.0434 11.56 R-Sq (adj) = 86.9% Predictor Constant Pressure S = 0.0397695 slope intercept Coef 0.1055 0.5017 R-Sq = 87.55% P 0.000 0.000 (c) Calculate a point estimate of the true average bond capacity when lateral pressure is 0.15fu (Round your answer to four decimal places.) Would you feel comfortable using the least squares line to predict strength when pressure is 2.0? O Yes, this value is inside of the range of x values of the data values. O Yes, this value is inside of the range of y values of the data values. O No, this value is way beyond the range of the x values of the data values. O No, this value is way beyond the range of the y values of the data values. (d) What is the correlation between the ratio and pressure? (Enter your answer to four decimal places.) Will the correlation between the pressure and ratio change if we change the measurement units for both variables? O Yes, the correlation will change with the unit of pressure. Yes, Yes, the correlation will change with the unit of pressure and ratio. Yes, the correlation will change with the unit of ratio. O No, the correlation will stay the same.
Step by Step Solution
3.45 Rating (155 Votes )
There are 3 Steps involved in it
The detailed answer for the above question is provided below from given output slo... View full answer

Get step-by-step solutions from verified subject matter experts