

Question: a. Draw a graph illustrating the crossover (or difference) points. b. Determine the number of units where either choice has the same cost. 40,000 Minimum
a. Draw a graph illustrating the crossover (or difference) points.
b. Determine the number of units where either choice has the same cost.
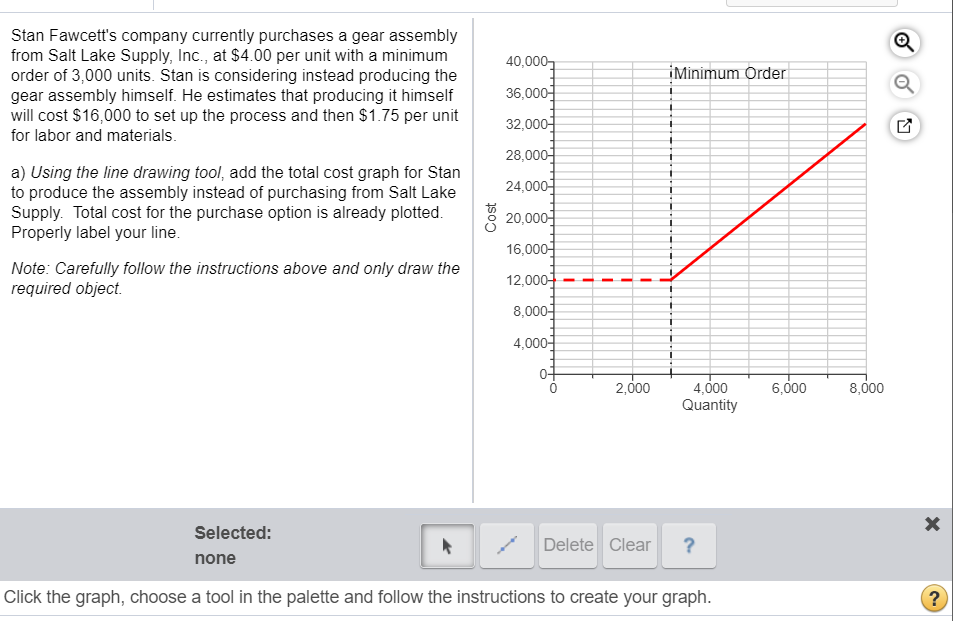
40,000 Minimum Order Stan Fawcett's company currently purchases a gear assembly from Salt Lake Supply, Inc., at $4.00 per unit with a minimum order of 3,000 units. Stan is considering instead producing the gear assembly himself. He estimates that producing it himself will cost $16,000 to set up the process and then $1.75 per unit for labor and materials. 36,000 a) Using the line drawing tool, add the total cost graph for Stan to produce the assembly instead of purchasing from Salt Lake Supply Total cost for the purchase option is already plotted. Properly label your line. 32.000] 28,0001 24,000 E 20,000 16,000 12,000 8,000 4,000 Note: Carefully follow the instructions above and only draw the required object 0 2 .000 4.000 Quantity 6,000 8,000 Selected: none A Delete Clear ? Click the graph, choose a tool in the palette and follow the instructions to create your graphStep by Step Solution
There are 3 Steps involved in it
1 Expert Approved Answer
Step: 1 Unlock

Question Has Been Solved by an Expert!
Get step-by-step solutions from verified subject matter experts
Step: 2 Unlock
Step: 3 Unlock