(a) Draw a screening curve, and give the most efficient plants over various ranges of expected utilization....
Question:
(a) Draw a screening curve, and give the most efficient plants over various ranges of expected utilization. There are 8,760 hours in a year).
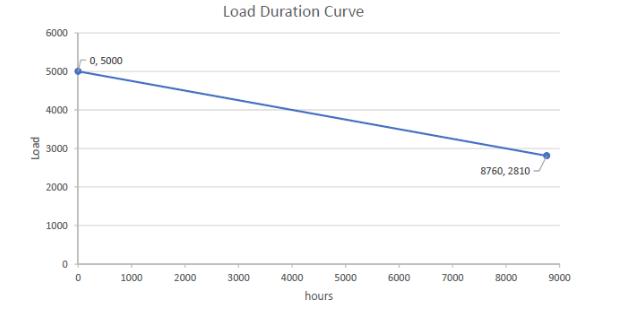
(b) Using the load duration curve, determine the optimal plant mix.
(c) Suppose we price shortage at $1,560 / MWh; how would this change the optimal plant mix? How many hours of shortage should we expect annually?
(d) The government of the country has decided that 2000 MW of wind must be built. However, wind is not always available: there's a 0.5 probability of 25% of the wind, 0.5 prob- ability of 75% of the wind being available at any time. What does the new net-load duration curve look like? (You do not need to recompute the optimal investments.)
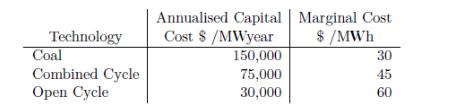
A neighbouring country is looking to establish a centrally managed electricity system. They have approached you to determine the optimal mix of plant technologies to build in order to most efficiently meet demand. They have provided you with a projected load dura- tion curve shown in Figure 1), and the marginal and annualized capital costs for three technologies, shown in the table below.
Expert Answer:
a A screening curve is a graph that shows the relationship between the capacity factor of a power plant and its levelized cost of electricity LCOE The capacity factor is the ratio of the actual output ... View the full answer