

Question: a) Draw a Table, with a clear title, showing the altitude (m) and ambient temperatures (C) of the following sites in Limpopo and Mpumalanga, South
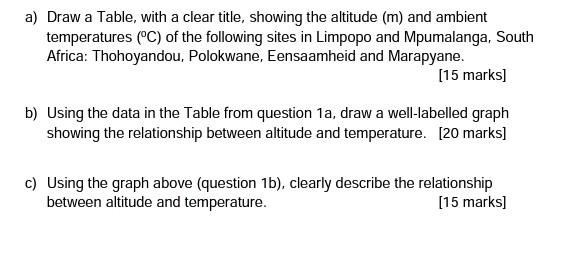
a) Draw a Table, with a clear title, showing the altitude (m) and ambient temperatures (C) of the following sites in Limpopo and Mpumalanga, South Africa: Thohoyandou, Polokwane, Eensaamheid and Marapyane. [15 marks) b) Using the data in the Table from question 1a, draw a well-labelled graph showing the relationship between altitude and temperature. [20 marks] c) Using the graph above (question 1b), clearly describe the relationship between altitude and temperature. [15 marks)
Step by Step Solution
There are 3 Steps involved in it
1 Expert Approved Answer
Step: 1 Unlock

Question Has Been Solved by an Expert!
Get step-by-step solutions from verified subject matter experts
Step: 2 Unlock
Step: 3 Unlock