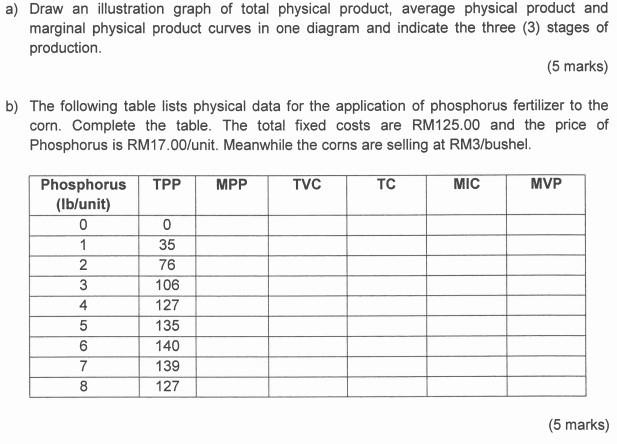
Question: a) Draw an illustration graph of total physical product, average physical product and marginal physical product curves in one diagram and indicate the three (3)

a) Draw an illustration graph of total physical

a) Draw an illustration graph of total physical product, average physical product and marginal physical product curves in one diagram and indicate the three (3) stages of production. (5 marks) b) The following table lists physical data for the application of phosphorus fertilizer to the corn. Complete the table. The total fixed costs are RM125.00 and the price of Phosphorus is RM17.00/unit. Meanwhile the corns are selling at RM3/bushel. TPP MPP TVC TC MIC MVP Phosphorus (lb/unit) 0 1 2 3 4 5 6 7 8 0 35 76 106 127 135 140 139 127 5 00

Step by Step Solution

There are 3 Steps involved in it

1 Expert Approved Answer
Step: 1 Unlock blur-text-image
Question Has Been Solved by an Expert!

Get step-by-step solutions from verified subject matter experts

Step: 2 Unlock
Step: 3 Unlock

Students Have Also Explored These Related General Management Questions!