

Question: (a) Draw the control chart that shows the evolution of the rate U= defects/unit (in %) in one week. If the same number of units
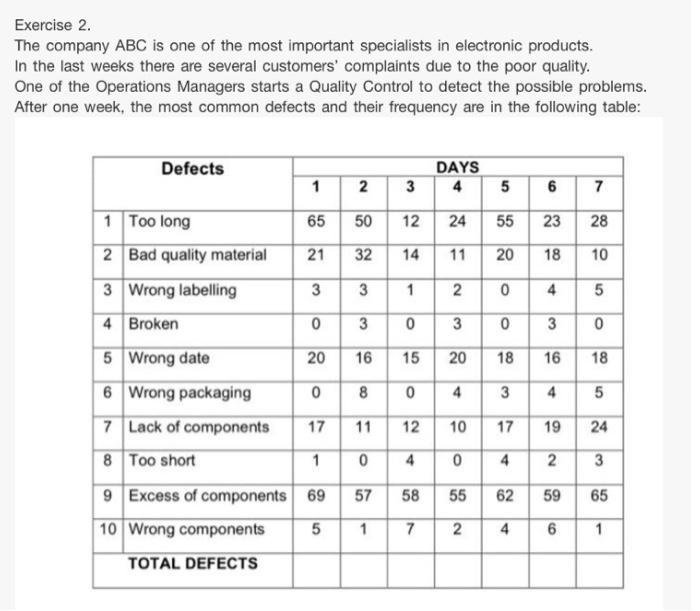
Exercise 2. The company ABC is one of the most important specialists in electronic products. In the last weeks there are several customers' complaints due to the poor quality. One of the Operations Managers starts a Quality Control to detect the possible problems. After one week, the most common defects and their frequency are in the following table: Defects 1 Too long 2 3 Wrong labelling 4 Broken 5 Wrong date 6 Wrong packaging 7 Lack of components 8 Too short Bad quality material 9 Excess of components 10 Wrong components TOTAL DEFECTS DAYS 1 3 4 5 6 7 65 12 24 55 23 28 21 14 11 20 18 10 3 3 1 2 0 4 5 0 3 0 3 0 3 0 20 16 15 18 16 18 0 8 0 3 4 5 17 11 12 17 19 24 1 0 4 0 4 2 3 69 58 55 62 5 1 7 2 4 2 50 32 57 20 4 10 59 65 6 1
Step by Step Solution
3.43 Rating (156 Votes )
There are 3 Steps involved in it
Step 12 With the help of the given table we will be here constructing a control chart and sort the defects in three groups according to the frequency Explanationfor step 1 a To draw the control chart ... View full answer

Get step-by-step solutions from verified subject matter experts