

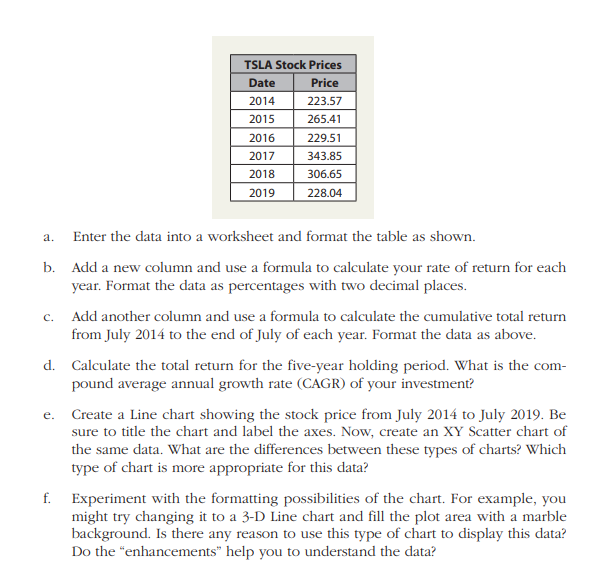
Question: a . Enter the data into a worksheet and format the table as shown. b . Add a new column and use a formula to
a Enter the data into a worksheet and format the table as shown.
b Add a new column and use a formula to calculate your rate of return for each
year. Format the data as percentages with two decimal places.
c Add another column and use a formula to calculate the cumulative total return
from July to the end of July of each year. Format the data as above.
d Calculate the total return for the fiveyear holding period. What is the com
pound average annual growth rate CAGR of your investment?
e Create a Line chart showing the stock price from July to July Be
sure to title the chart and label the axes. Now, create an XY Scatter chart of
the same data. What are the differences between these types of charts? Which
type of chart is more appropriate for this data?
f Experiment with the formatting possibilities of the chart. For example, you
might try changing it to a D Line chart and fill the plot area with a marble
background. Is there any reason to use this type of chart to display this data?
Do the "enhancements" help you to understand the data?
Step by Step Solution
There are 3 Steps involved in it
1 Expert Approved Answer
Step: 1 Unlock

Question Has Been Solved by an Expert!
Get step-by-step solutions from verified subject matter experts
Step: 2 Unlock
Step: 3 Unlock