

Question: a ) . Explain how the function myplot ( ) works ( this is not buit - in R function. You can also Learn how
a Explain how the function myplot works this is not buitin R function. You
can also Learn how to write your own function
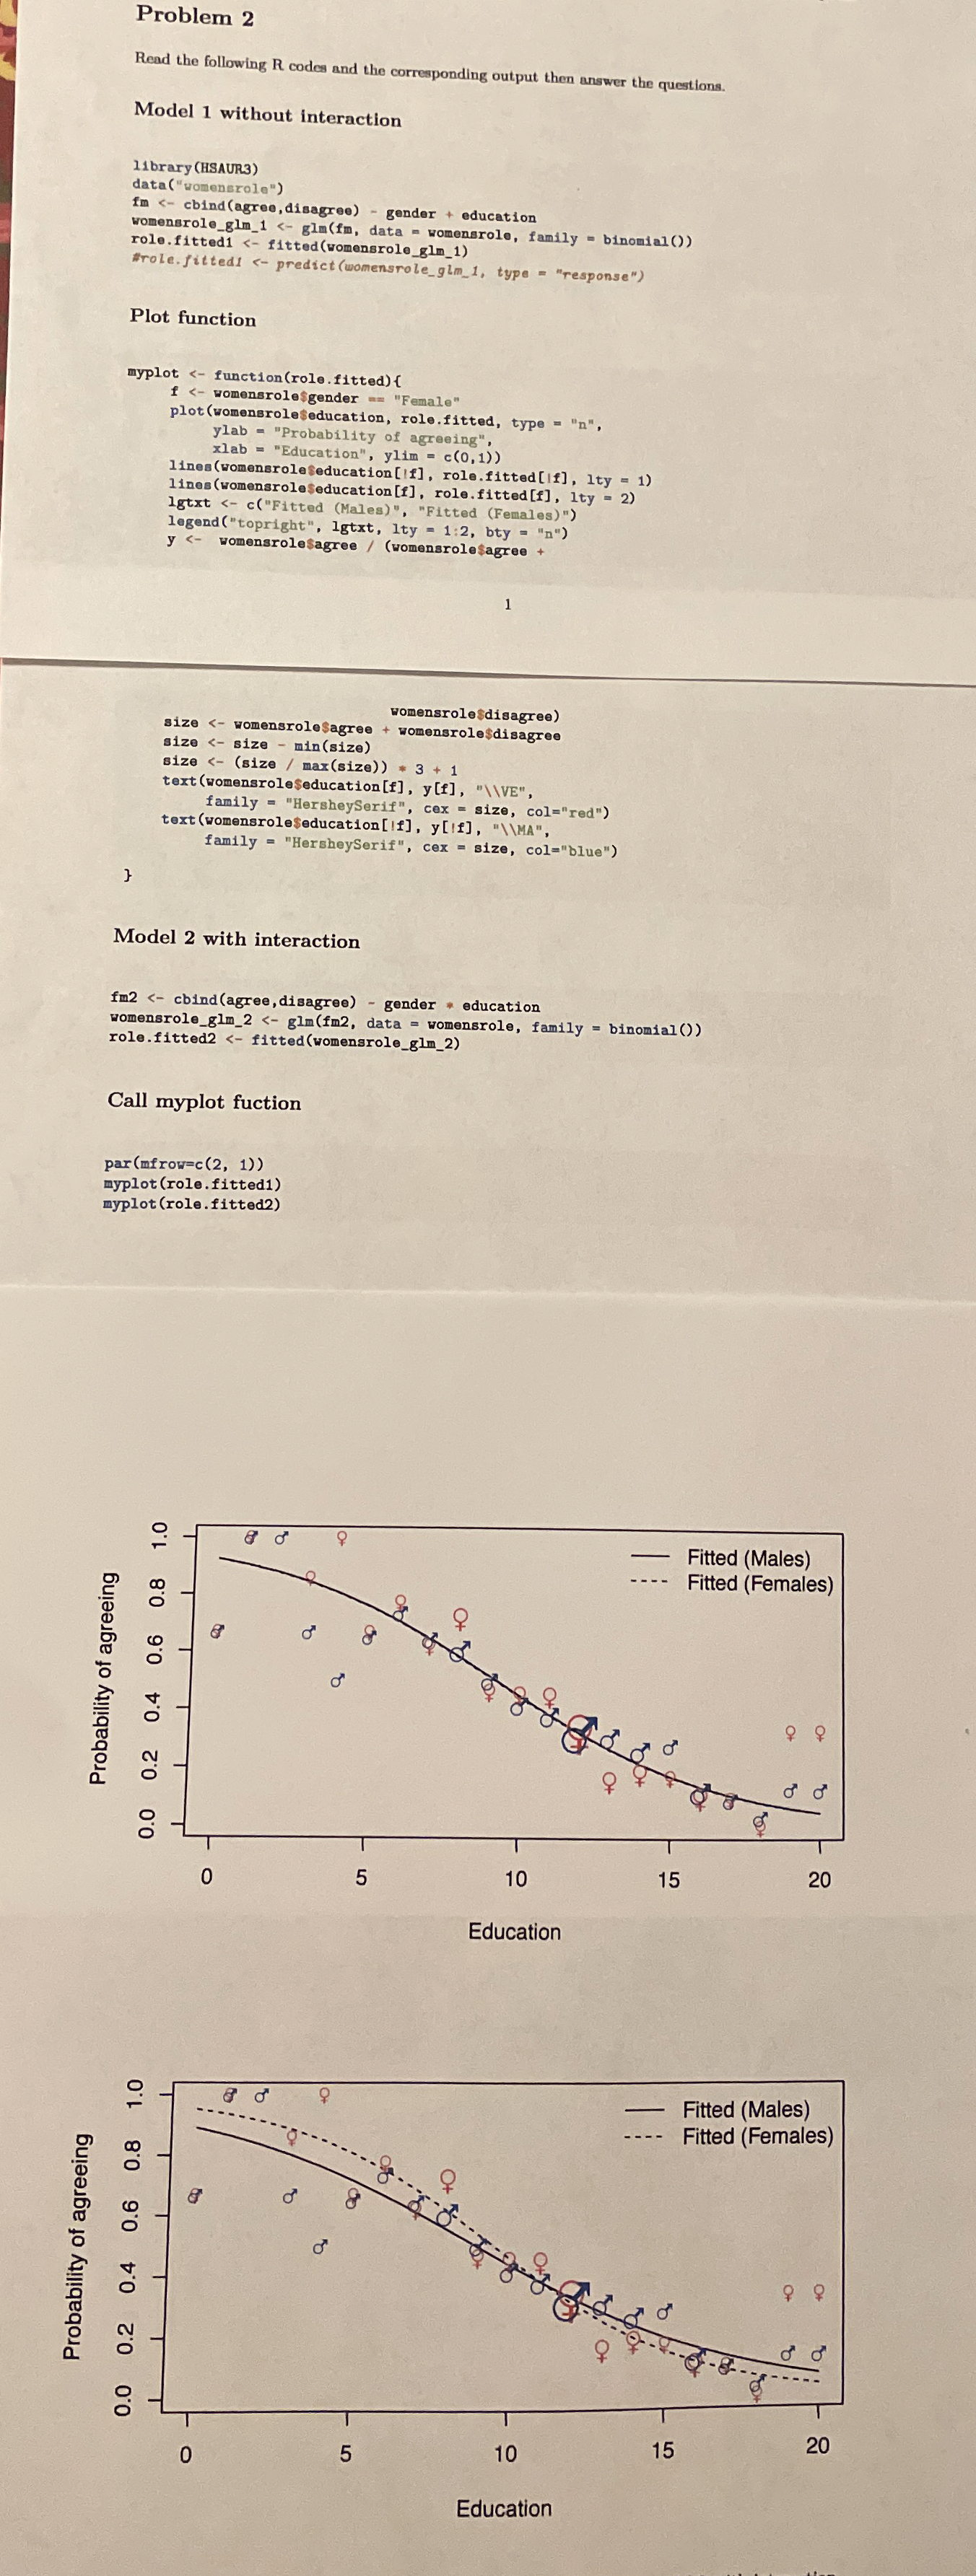
b Compare this two models and write a summary of the findings.
Problem
Read the following R codes and the corresponding output then answer the questions.
Model without interaction
braryHSAUR
datawomensrole
womensrole cbind agree disagree gender education
womensroleglm glmfm data vomensrole, family binomial
#role. fitted predictwomensigglm
Plot function
myplot functionrolefitted
f womensrolesgender "Female"
plotwomensrole$education, role.fitted, type n
ylab "Probability of agreeing",
Iineswomensroleseducationf role.fittedf lty
lineswomensrole$educationf role.fittedfty
legendtopright lgtxt lty Females
y vomensrolesagree ; vomensrole$agree
size womensroleagreewomensroledisagree
size size minsize
text womensre maxsize
family "HersheySerif", yfVE
textwomensrole$educationIf ylfex size, col"red"
family "HersheySerif", ylfMA
Model with interaction
fm cbindagree di sagree gendor education
vomensroleglm fm data romensrole, family binomial
role.fitted fittedwomensroleglm
Call myplot fuction
par
myplotrolefitted
myplotrolefitted
Step by Step Solution
There are 3 Steps involved in it
1 Expert Approved Answer
Step: 1 Unlock

Question Has Been Solved by an Expert!
Get step-by-step solutions from verified subject matter experts
Step: 2 Unlock
Step: 3 Unlock