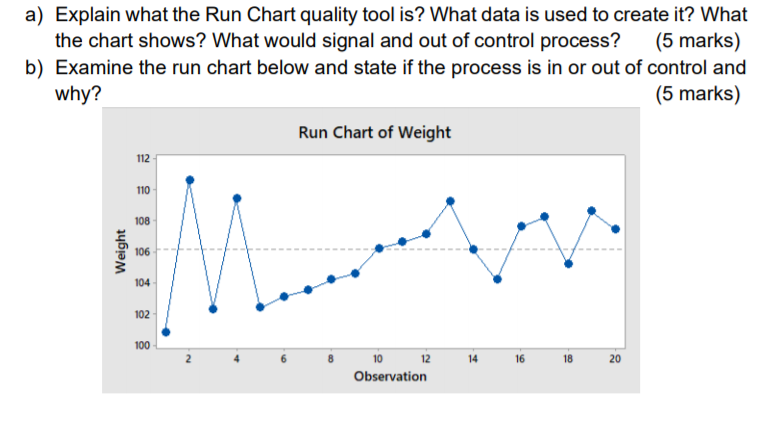
Question: a) Explain what the Run Chart quality tool is? What data is used to create it? What the chart shows? What would signal and out

a) Explain what the Run Chart quality tool is?

a) Explain what the Run Chart quality tool is? What data is used to create it? What the chart shows? What would signal and out of control process? (5 marks) b) Examine the run chart below and state if the process is in or out of control and why? (5 marks) Run Chart of Weight 112 110 108 Weight 106 104 102 100 14 16 18 10 12 Observation 20

Step by Step Solution

There are 3 Steps involved in it

1 Expert Approved Answer
Step: 1 Unlock blur-text-image
Question Has Been Solved by an Expert!

Get step-by-step solutions from verified subject matter experts

Step: 2 Unlock
Step: 3 Unlock

Students Have Also Explored These Related General Management Questions!