

Question: A fellow engineer has recorded raw stress-strain data (elongation vs. force) for several samples. Your role is to develop a MATLAB program to simplify
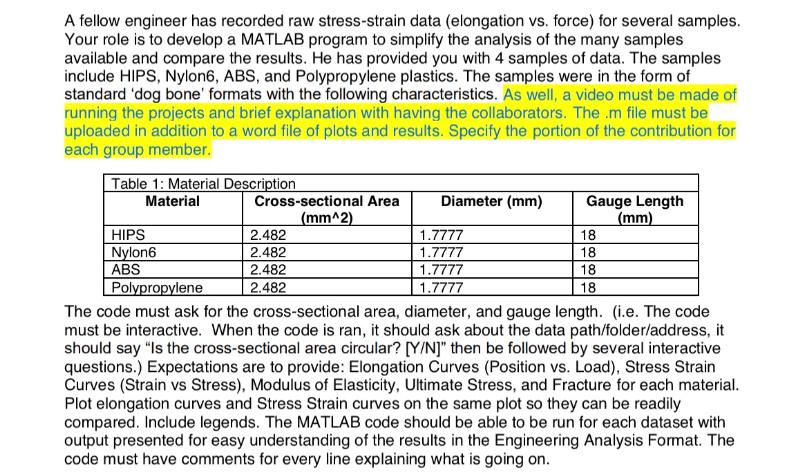
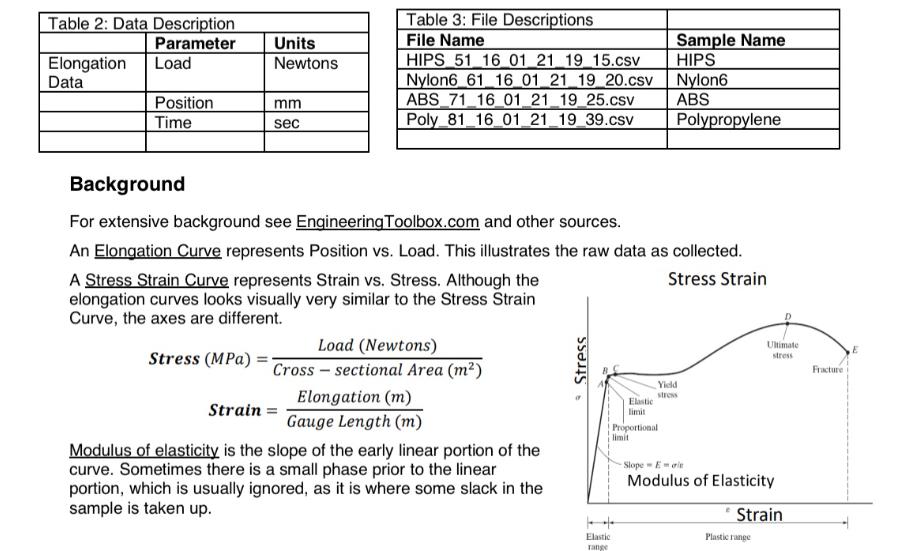
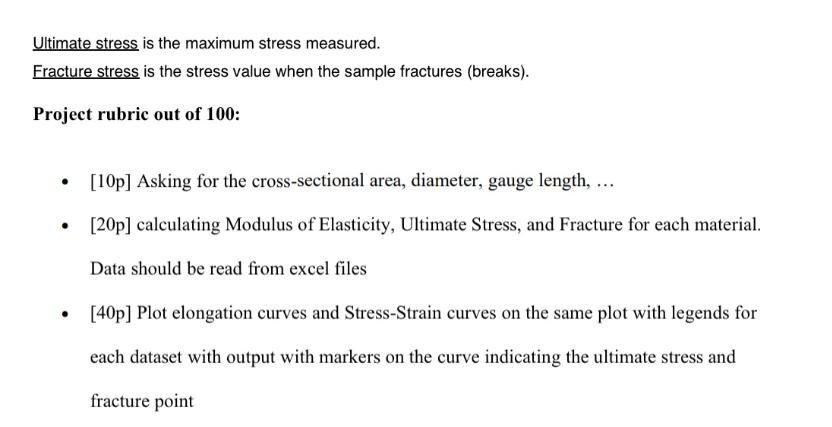
A fellow engineer has recorded raw stress-strain data (elongation vs. force) for several samples. Your role is to develop a MATLAB program to simplify the analysis of the many samples available and compare the results. He has provided you with 4 samples of data. The samples include HIPS, Nylon6, ABS, and Polypropylene plastics. The samples were in the form of standard 'dog bone' formats with the following characteristics. As well, a video must be made of running the projects and brief explanation with having the collaborators. The .m file must be uploaded in addition to a word file of plots and results. Specify the portion of the contribution for each group member. Table 1: Material Description Material HIPS Nylon6 ABS Cross-sectional Area (mm^2) 2.482 2.482 2.482 2.482 Diameter (mm) 1.7777 1.7777 1.7777 1.7777 Gauge Length (mm) 18 18 18 18 Polypropylene The code must ask for the cross-sectional area, diameter, and gauge length. (i.e. The code must be interactive. When the code is ran, it should ask about the data path/folder/address, it should say "Is the cross-sectional area circular? [Y/N]" then be followed by several interactive questions.) Expectations are to provide: Elongation Curves (Position vs. Load), Stress Strain Curves (Strain vs Stress), Modulus of Elasticity, Ultimate Stress, and Fracture for each material. Plot elongation curves and Stress Strain curves on the same plot so they can be readily compared. Include legends. The MATLAB code should be able to be run for each dataset with output presented for easy understanding of the results in the Engineering Analysis Format. The code must have comments for every line explaining what is going on. Table 2: Data Description Parameter Load Elongation Data Position Time Units Newtons mm sec Table 3: File Descriptions File Name HIPS 51 16 01 21 19 15.csv Nylon6 61 16 01 21 19 20.csv ABS_71_16_01_21_19_25.csv Poly_81_16_01_21_19_39.csv A Stress Strain Curve represents Strain vs. Stress. Although the elongation curves looks visually very similar to the Stress Strain Curve, the axes are different. Stress (MPa) Background For extensive background see Engineering Toolbox.com and other sources. An Elongation Curve represents Position vs. Load. This illustrates the raw data as collected. Stress Strain Load (Newtons) Cross-sectional Area (m) Elongation (m) Gauge Length (m) Strain = Modulus of elasticity is the slope of the early linear portion of the curve. Sometimes there is a small phase prior to the linear portion, which is usually ignored, as it is where some slack in the sample is taken up. Stress Elastic range Sample Name HIPS Nylon6 ABS Polypropylene Elastic limit Proportional limit Yield stress Ultimate stress Slope Erit Modulus of Elasticity Strain Plastic range Fracture Ultimate stress is the maximum stress measured. Fracture stress is the stress value when the sample fractures (breaks). Project rubric out of 100: . [10p] Asking for the cross-sectional area, diameter, gauge length, ... [20p] calculating Modulus of Elasticity, Ultimate Stress, and Fracture for each material. Data should be read from excel files [40p] Plot elongation curves and Stress-Strain curves on the same plot with legends for each dataset with output with markers on the curve indicating the ultimate stress and fracture point
Step by Step Solution
3.35 Rating (158 Votes )
There are 3 Steps involved in it
Here is the role of computational fluid dynamics CFD in process modeling Process Optimization via Nu... View full answer

Get step-by-step solutions from verified subject matter experts