

Question: A Fig . 1 Fig . 2 Fig. 3 I Recall from the lecture that the with Riemann sum of a continuous f ( x

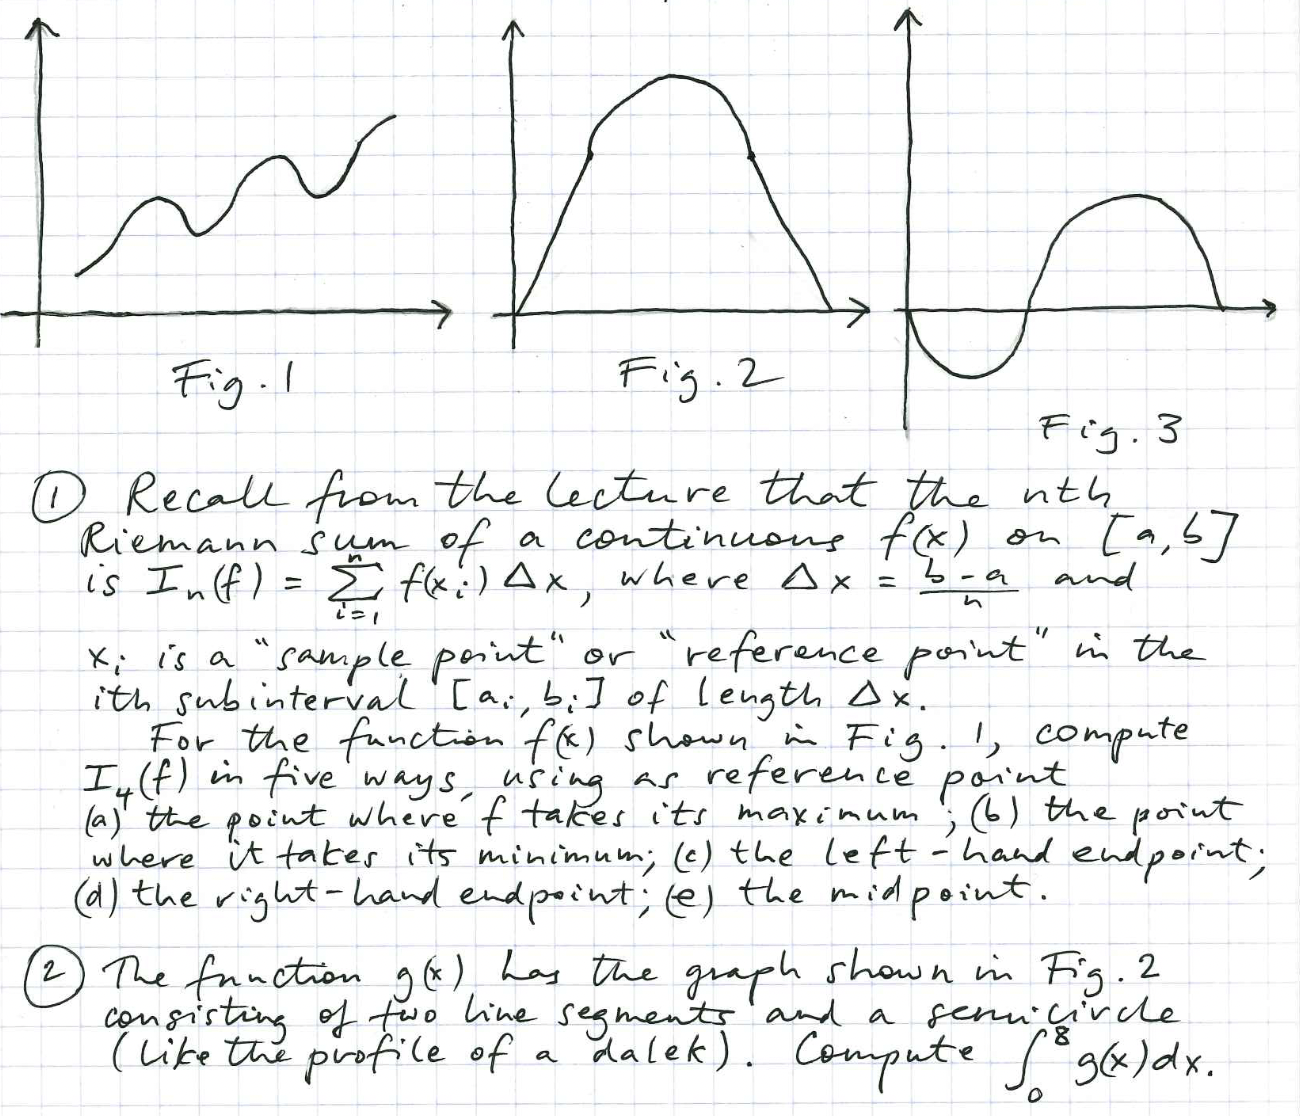
A Fig . 1 Fig . 2 Fig. 3 I Recall from the lecture that the with Riemann sum of a continuous f ( x ) on [a, b] is In ( f ) = >i f ( x: ) Ax, where Ax = b -a and X is a "sample point " or " reference point" in the ith subinterval [ a. b ; ] of length Ax . For the function f(x) shown in Fig. 1, compute In ( f ) in five ways using as reference point ( a) the point where f takes its maximum; (6) the point where it takes its minimum; ( c ) the left - hand endpoint: ( d ) the right- hand endpoint; (e) the midpoint. The function g ( x ) has the graph shown in Fig . 2 consisting of two line segments and a jenn- circle ( like the profile of a dalek ). Compute / 9 ( * )dx
Step by Step Solution
There are 3 Steps involved in it

Get step-by-step solutions from verified subject matter experts