

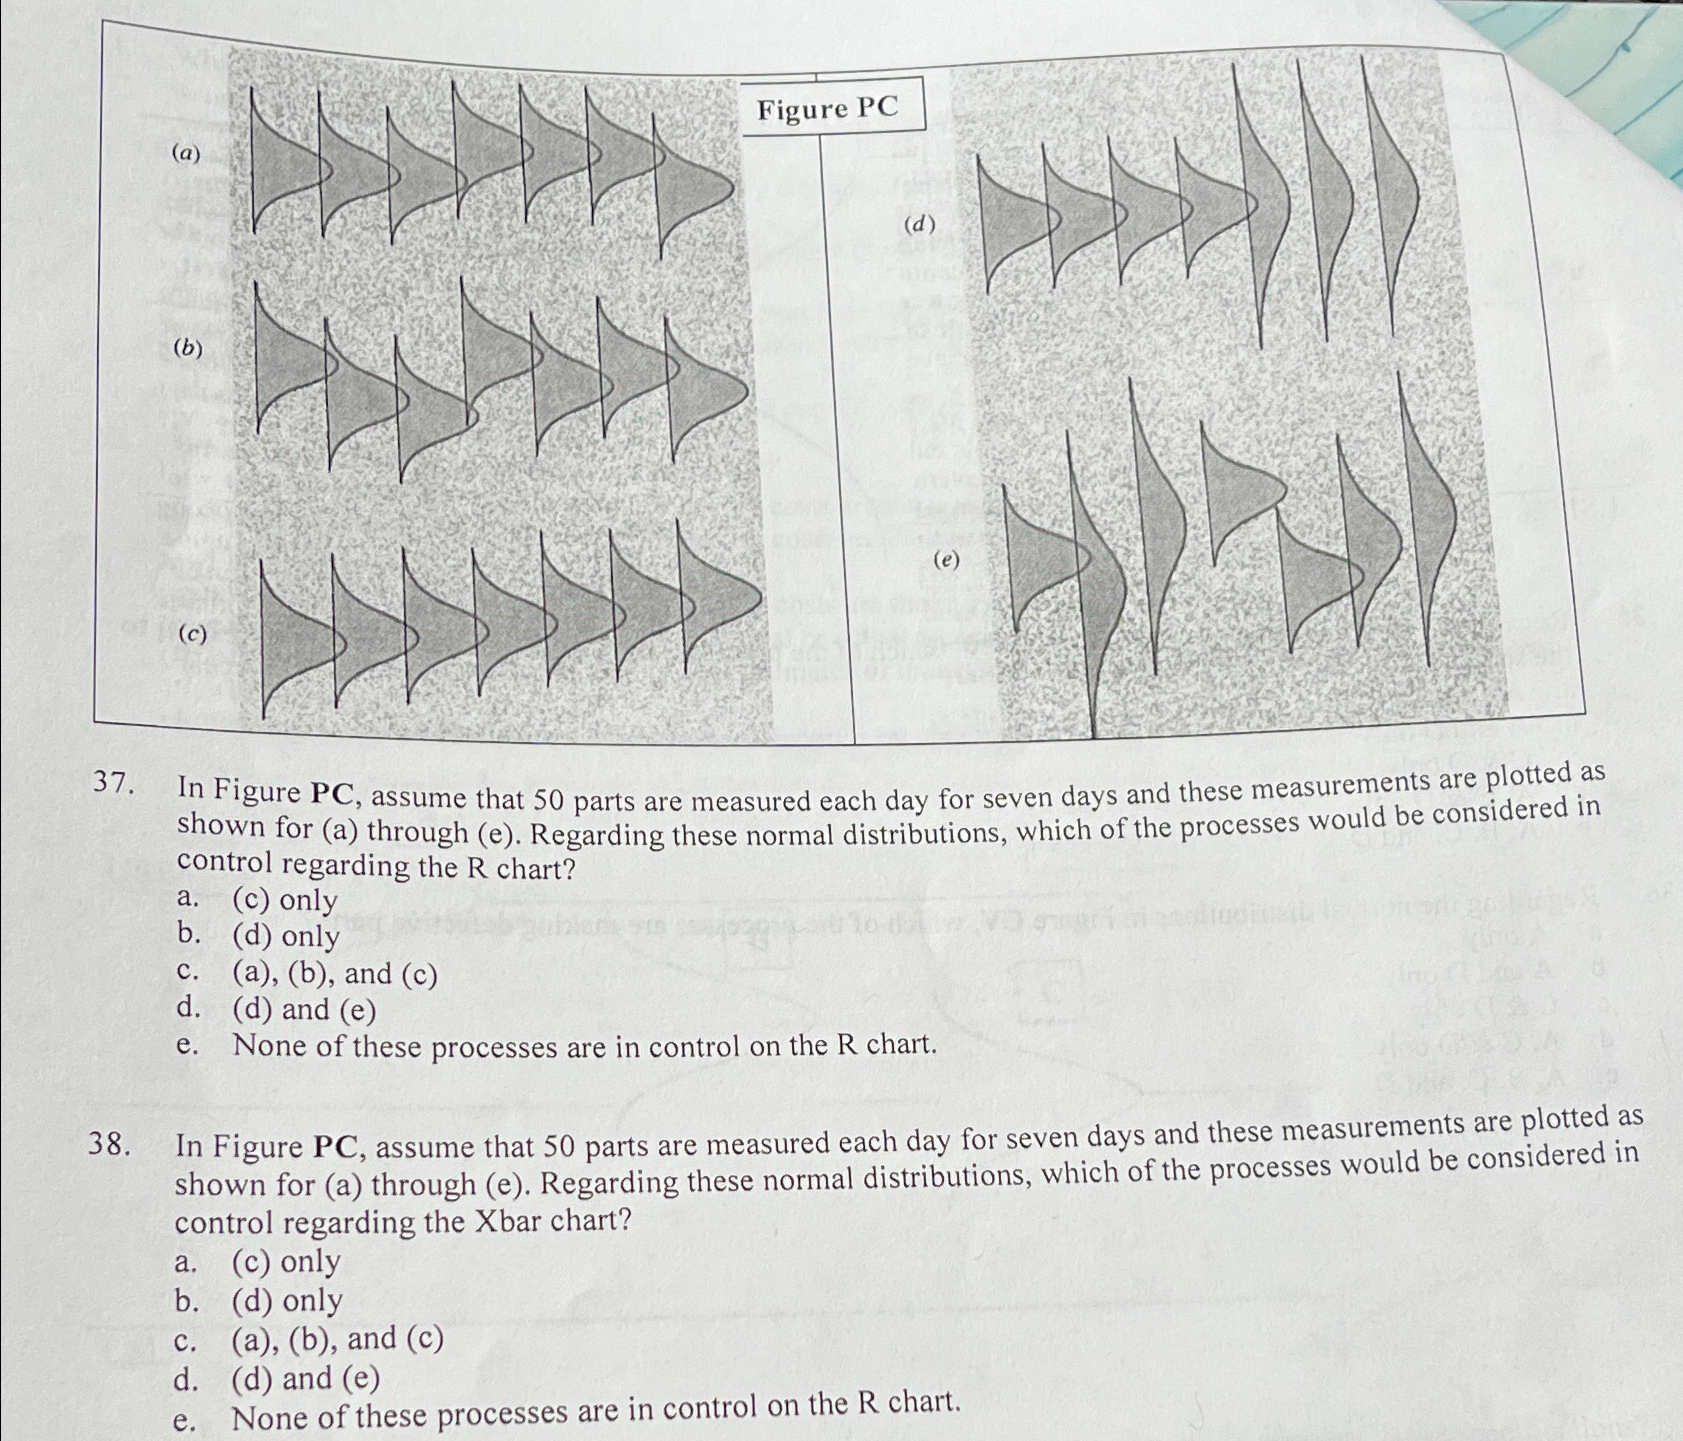
Question: ( a ) Figure PC ( b ) ( d ) ( e ) ( c ) 3 7 . In Figure PC , assume
a
Figure PC
b
d
e
c
In Figure PC assume that parts are measured each day for seven days and these measurements are plotted as shown for a through e Regarding these normal distributions, which of the processes would be considered in control regarding the chart?
ac only
bd only
cab and c
dd and e
e None of these processes are in control on the chart.
In Figure PC assume that parts are measured each day for seven days and these measurements are plotted as shown for a through e Regarding these normal distributions, which of the processes would be considered in control regarding the Xbar chart?
ac only
bd only
cab and c
dd and e
e None of these processes are in control on the chart.
Step by Step Solution
There are 3 Steps involved in it
1 Expert Approved Answer
Step: 1 Unlock

Question Has Been Solved by an Expert!
Get step-by-step solutions from verified subject matter experts
Step: 2 Unlock
Step: 3 Unlock