

Question: A file called avehighs.dat stores the average high temperatures for each month for a year (rounded to integers). The first column of the data stores
A file called avehighs.dat stores the average high temperatures for each month for a year (rounded to integers). The first column of the data stores the zip code, the 2nd to 13th columns store 12 temperatures. For example, the file might store:
65211 33 37 42 45 53 72 82 79 66 55 46 41
65201 29 33 41 46 52 66 77 88 68 55 48 39
65203 55 62 68 72 75 79 83 89 85 80 77 65
Write a function that will take in one input argument: the zip code. This function will first read in the data file, then find the line corresponding to the zip code, and plot the temperatures for all 12 months. The axis labels and titles should be as shown. The figure title should show the zipcode. For example, if the function is called as ShowTemp(65201), the following graph will be shown:
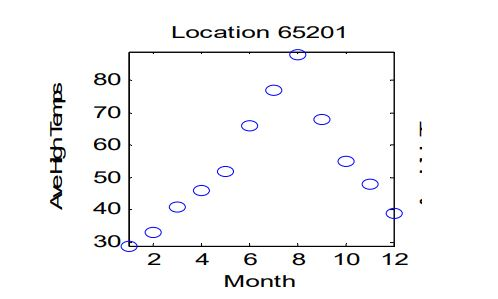
Location 65201 80 70 60 50 40 30b 2 4 6 8 10 12 Month
Step by Step Solution
There are 3 Steps involved in it

Get step-by-step solutions from verified subject matter experts